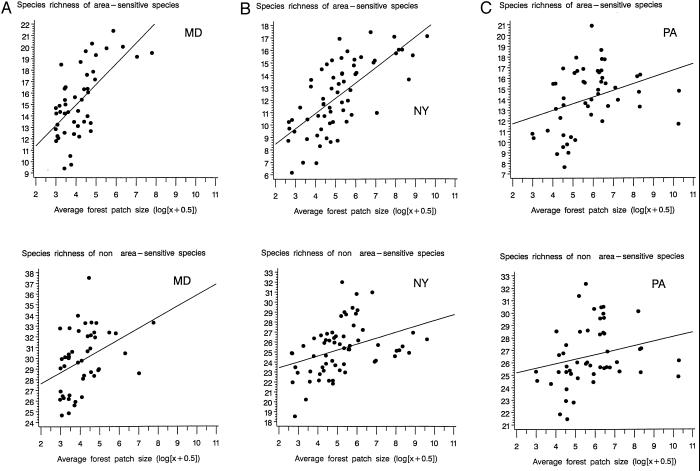
Figure 1.
Relation between the mean species richness over the study period and the average forest patch size of a scene centered on each BBS route in 1974 (average forest patch size was log-transformed). Graphs were drawn for area-sensitive and non-area-sensitive species for the states of Maryland (A), New York (B), and Pennsylvania (C). Mean species richness was computed for survey routes for which more than 15 estimates of species richness were available over the 22-year period considered (1975–1996).

