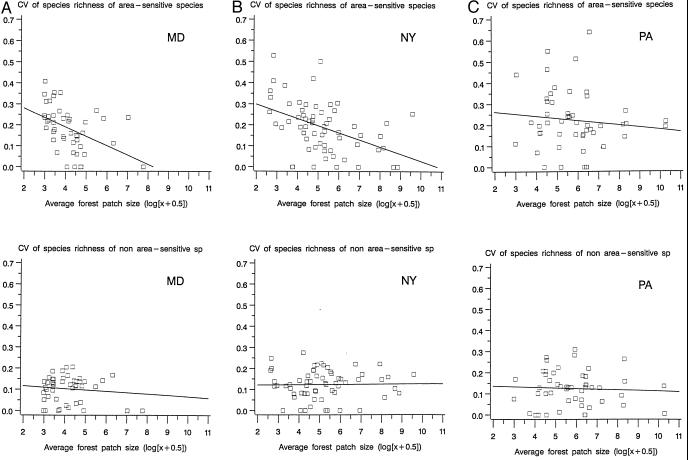
Figure 2.
Relation between the CV of species richness and the average forest patch size of a scene centered on each BBS route in 1974 (average forest patch size was log-transformed). Graphs were drawn for area-sensitive and non-area-sensitive species for the states of Maryland (A), New York (B), and Pennsylvania (C). CVs were computed for survey routes for which a minimum of 15 estimates of species richness was available over the 22-year period considered (1975–1996).

