Figure 2.
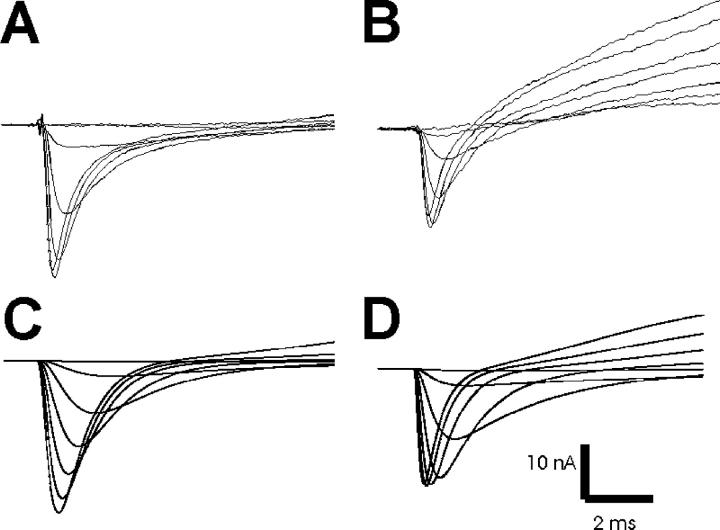
Real and simulated patch currents. Shown on the top row are patch currents obtained from muscle fibers near the endplate (A) and away from the endplate (B). The outward potassium current is larger away from the endplate. On the bottom row are patch currents simulated with parameters used previously to model muscle fiber action potentials (Cannon et al., 1993) (C) and simulated currents in which rate parameters have been adjusted to speed sodium and potassium channel gating (D). Previously used parameters resulted in potassium currents that were too small and sodium currents that peaked too slowly. In both the real and modeled currents, the traces shown represent currents evoked after steps to −70 mV up to −10 mV in 10-mV increments. In both the real currents and the optimized modeled currents, the peak current was evoked following a step to −20 mV.

