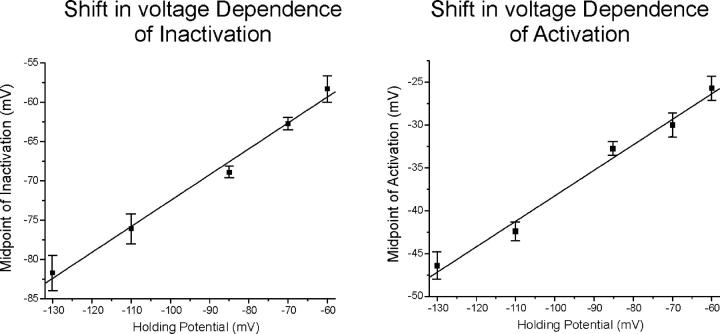
Figure 5.
The voltage dependence of shifts in the midpoint of sodium channel gating. Shown on the left is the plot of the midpoint of fast inactivation versus holding potential. On the right is the plot of the midpoint of activation versus holding potential. Both sets of data are fit well (R = 0.99, P < 0.01) with a linear fit with a slope of 0.29. For the number of fibers at each holding potential refer to Table II

