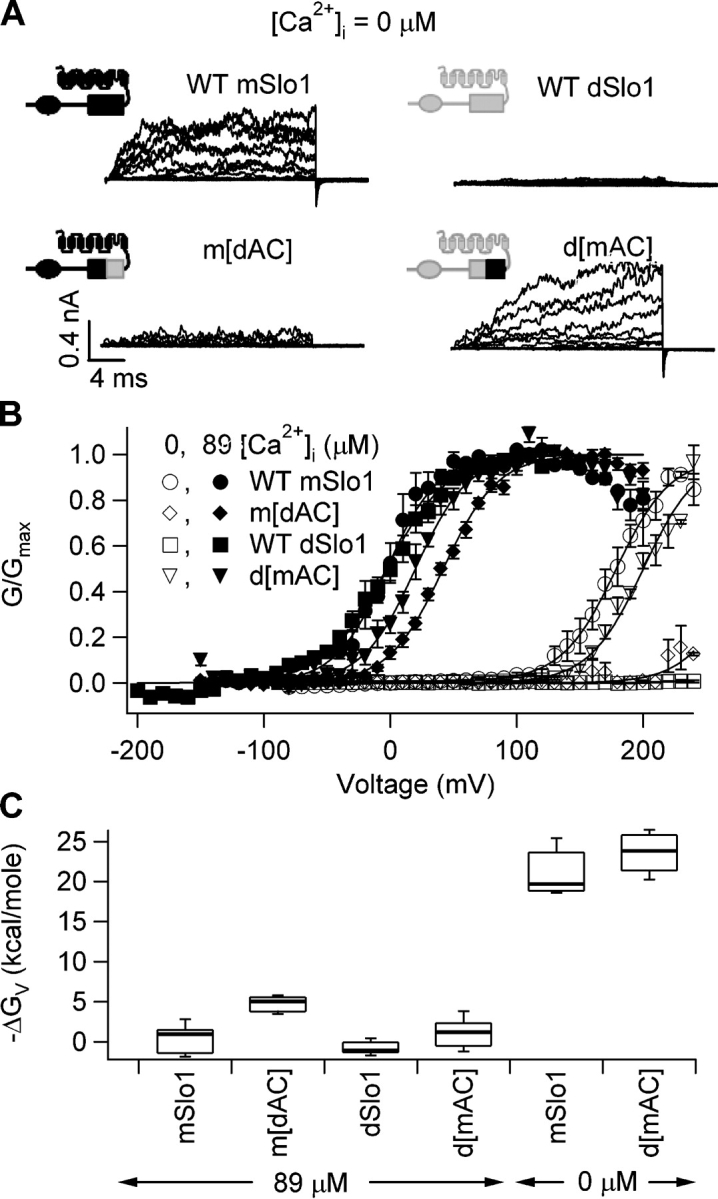
Figure 10.

Modulation of BKCa activation by the AC region depends on Ca2+ occupancy. (A) Current traces of mSlo1, dSlo1, d[mAC], and m[dAC] at 0 [Ca2+]i. Test voltages were from −80 to 200 mV with a holding and repolarization potential of −50 mV. (B) Steady-state G-V relations of above channels at 0 (open symbols) and 89 μM (filled symbols) [Ca2+]i. Smooth curves are fits to the Boltzmann equation. At 89 μM [Ca2+]i, for mSlo1: V1/2 = −2.8 mV, z = 1.2; for d[mAC]: V1/2 = 7.7 mV, z = 1.4; for dSlo1: V1/2 = −2.9 mV, z = 1.1; for m[dAC]: V1/2 = 41.6 mV, z = 1.2. At 0 [Ca2+]i, for mSlo1: V1/2 = 179 mV, z = 1.2; for d[mAC]: V1/2 = 181 mV, z = 1.3. The voltage range of dSlo1 and m[dAC] activation at 0 [Ca2+]i is too positive to record any current. (C) Box plot of ΔGV = zV1/2 for the above channels at 0 and 89 μM [Ca2+]i. The percentile values shown are 10, 25, 50, 75, and 90 for each channel. ΔGV for m[dAC] and dSlo1 at 0 [Ca2+]i are too large to be determined.
