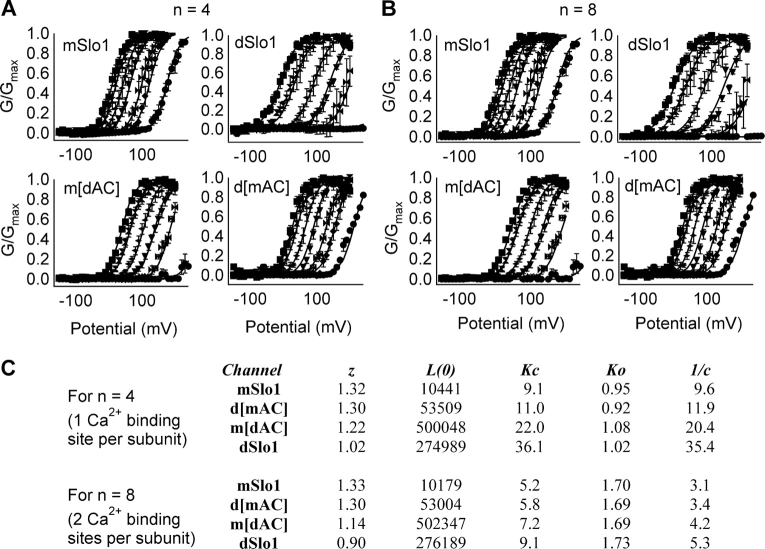
Figure 11.
The AC region affects Ca2+ binding to closed channels. (A and B) G-V relations of mSlo1, dSlo1, d[mAC], and m[dAC] channels at [Ca2+]i of 0, 1.7, 2.3, 5.7, 11.2, 28.5, and 89 μM. Each dataset was fit (smooth curves) by the MWC model (Eq. 4), n = 4 (A) or 8 (B). (C) Parameters of fits obtained from A and B.

