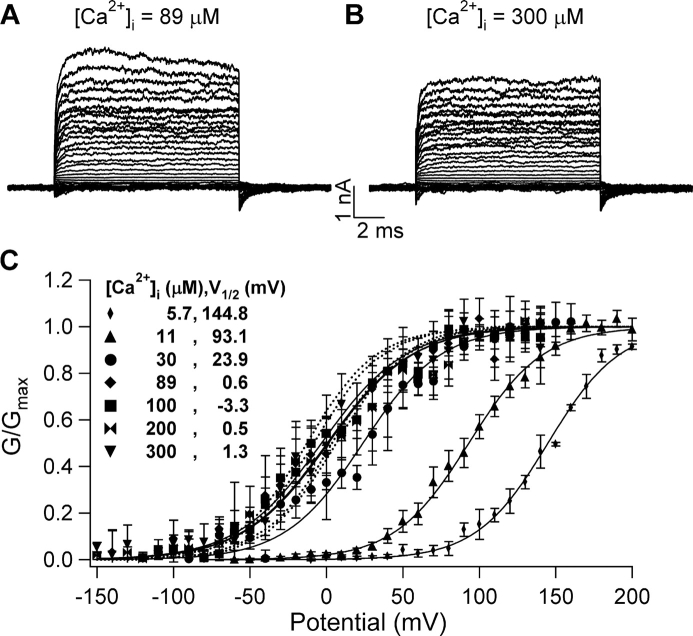
Figure 3.
Activation of dSlo1 saturates around 89 μM [Ca2+]i. (A and B) Current traces of dSlo1 for indicated [Ca2+]i elicited by voltages from −150 to 200 mV. (C) Steady-state G-V curves of dSlo1. Solid curves are fits of the Boltzmann equation. V1/2 obtained from the fits of the G-V relations at each [Ca2+]i is indicated. Dotted lines indicate MWC model simulations of the G-V relation at [Ca2+]i 89, 100, 200, and 300 μM using the same parameters as indicated in Fig. 10 C.

