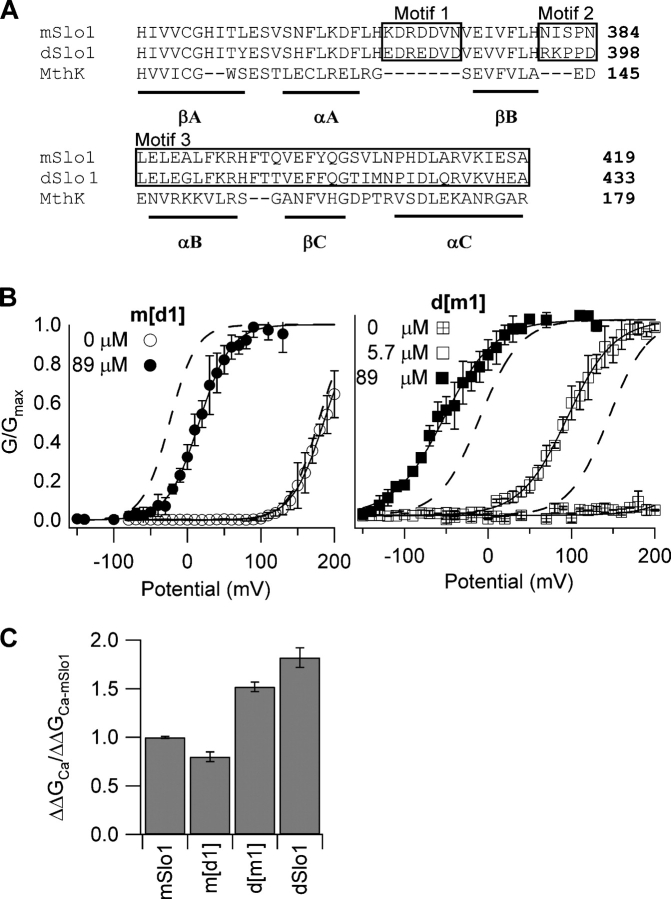
Figure 6.
Ca2+ sensitivity change is not related to the Ca2+ binding site in the AC region. (A) Sequence alignment of the AC region of the RCK1 domain (Jiang et al., 2002a) from mSlo1 (Butler et al., 1993), dSlo1 (Adelman et al., 1992), and the archeon MthK (Jiang et al., 2002a). Numbers indicate the position of the rightmost residues in the primary sequence of respective proteins. Secondary structures βA-C and αA-C are indicated by underlines. Boxed amino acids labeled as motifs 1, 2, and 3 are regions showing significant sequence differences between mSlo1 and dSlo1. Motif 1 is important for Ca2+-dependent activation (Shi et al., 2002; Xia et al., 2002). Effects of switching motif 1 between mSlo1 and dSlo1 are shown in B and C. (B, left) Steady-state G-V relations of the mutant channel m[d1] (motif 1 from dSlo1 in the mSlo1 background). Solid lines are fits of the Boltzmann equation with the following parameters: at 0 [Ca2+]i, V1/2 = 185 mV, z = 1.2; at 89 μM [Ca2+]i, V1/2 = 15.9 mV, and z = 1.2. Dotted lines are G-V relations of mSlo1. (B, right) Steady-state G-V relations of the mutant channel d[m1] (motif 1 from mSlo1 in the dSlo1 background). Solid lines are fits of the Boltzmann equation with the following parameters: at 89 μM [Ca2+]i, V1/2 = −52.5 mV, z = 0.83; at 5.7 μM [Ca2+]i, V1/2 = 95.1 mV and z = 0.89; at 0 [Ca2+]i, the G-V relation was too right shifted for z and V1/2 values to be determined. Dotted lines are G-V relations of dSlo1. (C) Free energy of activation provided by Ca2+ binding in mSlo1, d[m1], m[d1], and dSlo1 when [Ca2+]i increased from 0 to 89 μM (for m[d1]) and from 5.7 to 89 μM (for d[m1] and dSlo1), normalized against corresponding free energy values for mSlo1.

