
Figure 9.
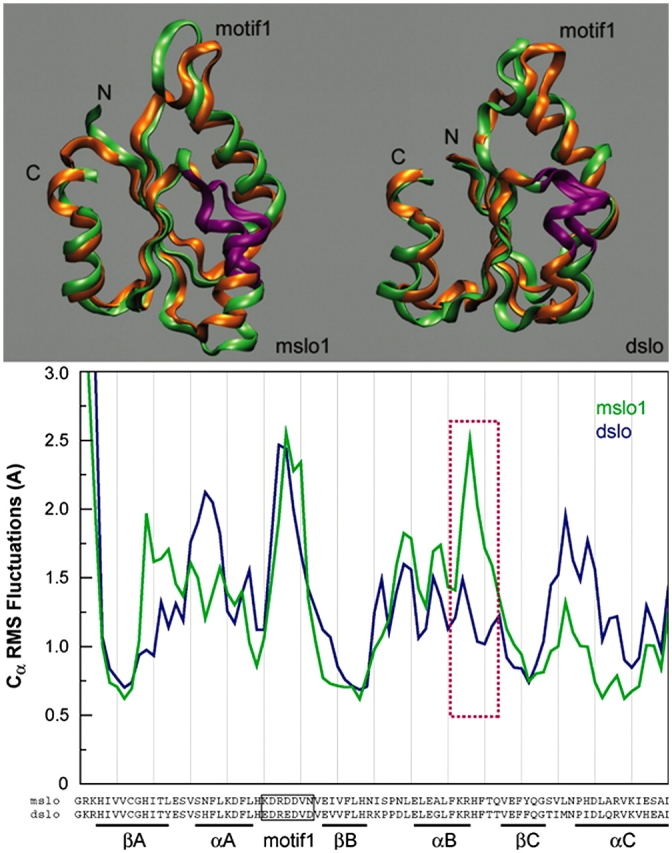
Molecular dynamics simulations of the AC region of mSlo1 and dSlo1. Top panels show the extrema (green and orange) of the motion along the principal eigenvector for the AC region from mSlo1 (left) and dSlo1 (right) (see MATERIALS AND METHODS). Part of helix B highlighted in purple shows the region of largest dynamic difference between the structures of mSlo1 and dSlo1. Bottom panel shows the RMS fluctuations for the Cα's of the above structure. The purple box denotes the same region (αB) highlighted above. Amino acid in the sequence at the bottom corresponds to the Cα whose dynamics are plotted above. Molecular graphics were produced using visual molecular dynamics (VMD) (Humphrey et al., 1996).