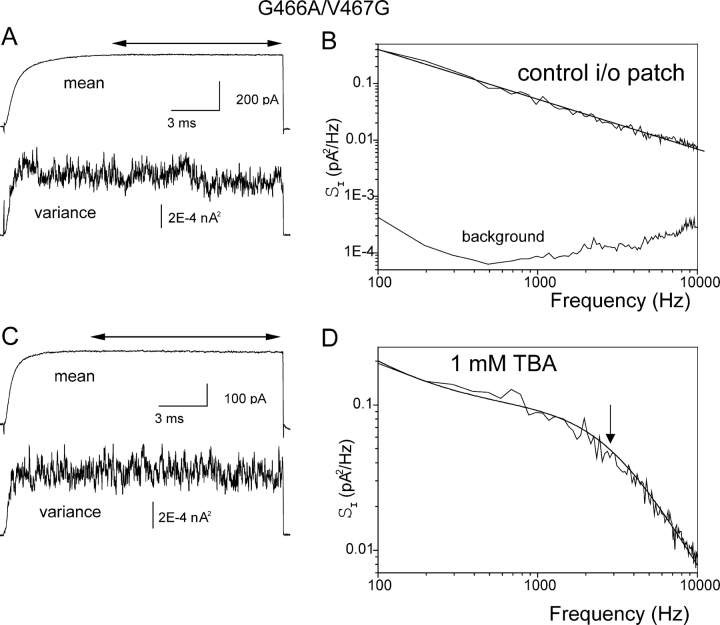
Figure 9.
Estimates of TBA blocking constants using stationary noise. Inside-out patches for G466A/V467G mutants in the absence (A and B) and presence (C and D) of 1 mM TBA. 160 depolarizations to +80 mV were applied, and stationary noise was measured over the intervals shown by the double arrows. A and C show mean and variance for these currents, with spectra shown in B and D. The spectrum of background noise at the −80 mV is shown in B. Data were fit by a weighted sum of a lorentzian and 1/f noise. The arrow indicates the corner frequency ƒc of the lorentzian in the patch exposed to 1 mM TBA.

