Fig. 3.
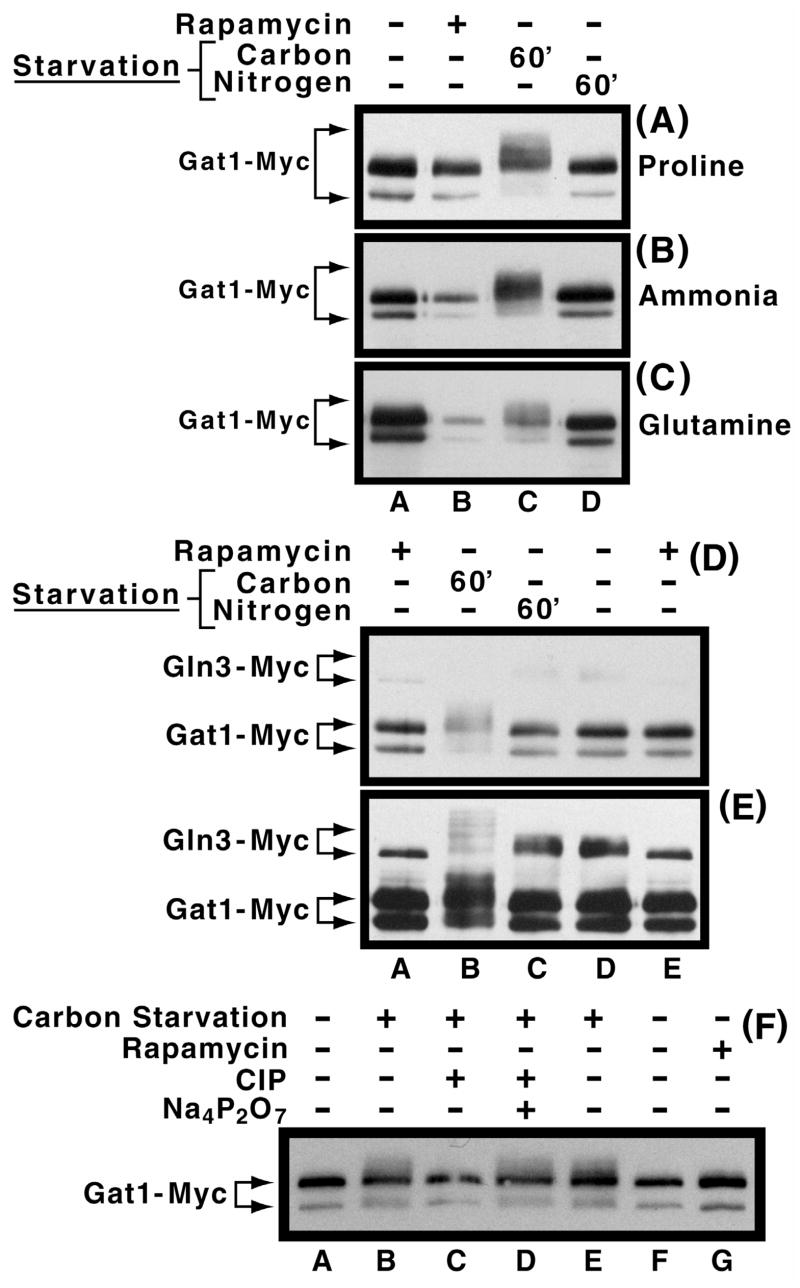
Panels A–C. Effect of nitrogen and carbon starvation on Gat1-Myc13 phosphorylation levels in cells provided with various nitrogen sources. Cultures of RJ715, transformed with pGAT1-Myc, were grown in YNB-proline (Panel A), ammonia (Panel B), or glutamine (Panel C) medium to mid-log phase. Cells were then transferred to the same medium devoid of either glucose (lane C) or the nitrogen source (lane D). After 60 min. of starvation, cells were harvested and extracts prepared as described in Materials and Methods. Untreated and rapamycin-treated cultures were included as controls (lanes A and B). Panels D and E. Comparison of the effects of nitrogen and carbon starvation on Gat1-Myc13 and Gln3-Myc13 phosphorylation. Experimental conditions were as in Panel B except that TB123 transformed with pGAT1-Myc was used in place of the RJ715 transformant. As described earlier, Panels D and E depict short and long exposures of the same gel. Panel F. Sensitivity of carbon starvation induced Gat1-Myc13 phosphorylation to phosphatase treatment. pGAT1-Myc transformants of RJ715 were grown in YNB-ammonia medium in the presence or absence of rapamycin as described earlier. Calf intestional alkaline phosphatase (CIP) in the presence or absence of its inhibitor, sodium pyrophosphate (Na4P2O7), were added, as described in Fig. 2, to extracts where indicated.

