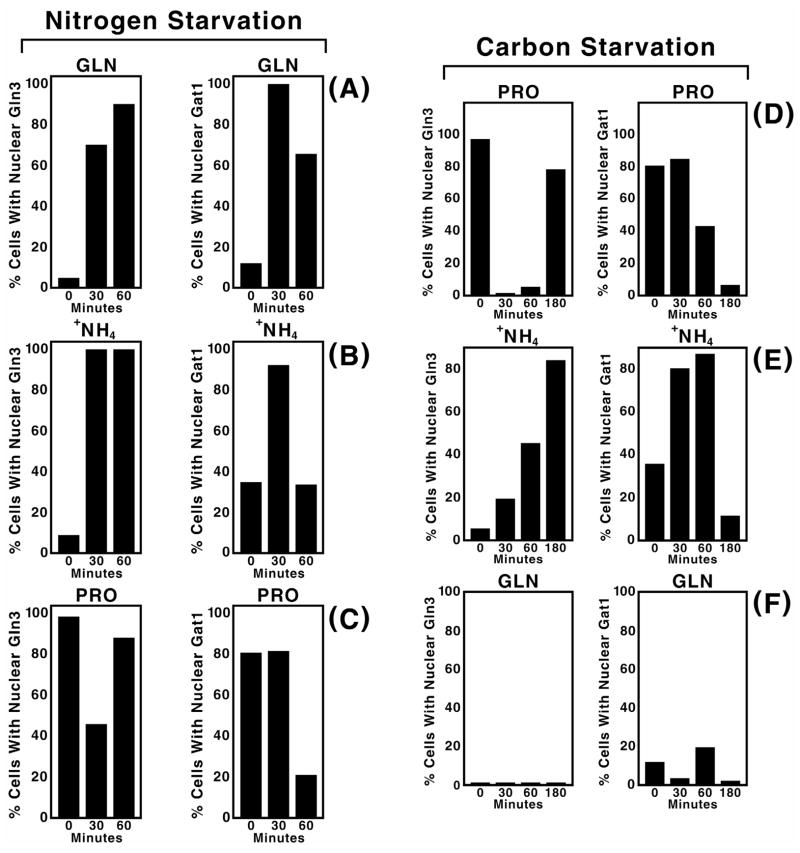
Fig. 4.
Comparison of Gat1-Myc13 and Gln3-Myc13 intracellular localization during nitrogen and carbon starvation of cells grown in YNB medium with glutamine, ammonia or proline as sole nitrogen source. Strains and culture conditions were similar to those used in Fig. 3, Panels A–C. Starvation times (min.) are indicated at the bottom of each histogram. Gat1-Myc13 was visualized by indirect immunofluorescence as described in Materials and Methods. Gln3-Myc13 data (all left panels) are reproduced from Ref. 20, describing a parallel analysis under the same conditions except that strain TB123 was used in place of RJ715 transformed with pGAT1-Myc. They are included here to facilitate the comparison between Gat1-Myc13 and Gln3-Myc13.

