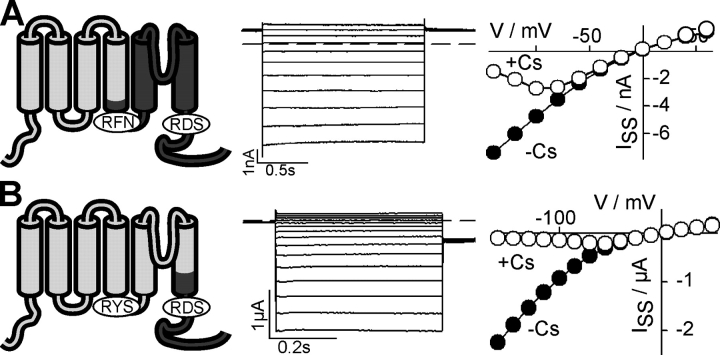
Figure 3.
AKT2-KAT1 chimeras show “open-locked” behavior. Chimeras' structure (see also Fig. 1) is indicated (left). Parts originating from AKT2 are illustrated in light gray and parts from KAT1 in dark gray. Current traces (middle) and steady-state current–voltage characteristics (right) of the chimeras. Currents were measured in standard solution (black circles) and after the addition of 10 mM Cs+ to external standard solution (white circles). The dashed lines indicate the zero current level. (A) Expression in COS cells. Currents elicited by 1.6-s voltage steps from a holding potential of +40 mV to voltages from +60 mV to −140 mV (20-mV decrements). (B) Expression in oocytes (100 mM KCl in the bath); 0.5-s voltage steps from 0 mV to voltages from +50 mV to −160 mV (15-mV decrements) followed by a step to −60 mV. Data displayed in A and B are representative for at least three repeats.

