Figure 6.
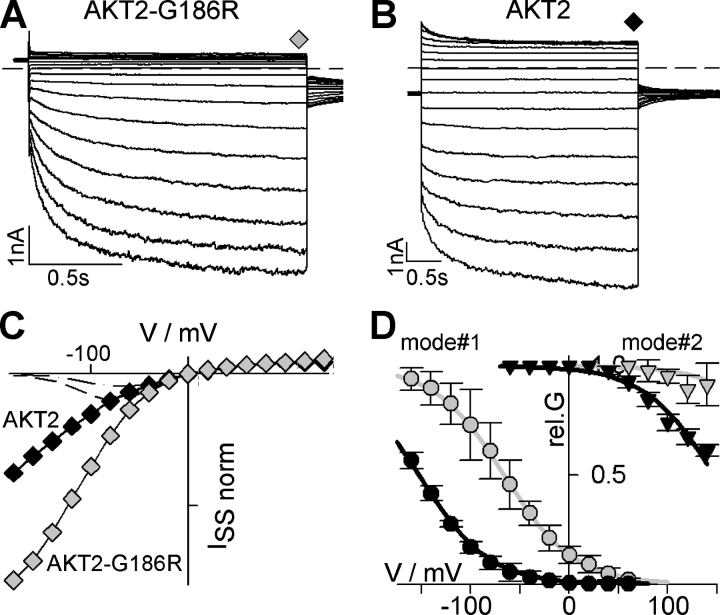
Mutation in S4 affects gating of AKT2. (A) Representative K+ currents obtained from one COS cell expressing the mutant AKT2-G186R. Currents elicited by 1.6-s voltage steps from a holding potential of +40 mV to voltages from +140 mV to −180 mV (20-mV decrements) followed by a further voltage step to −40 mV (dashed line, zero-current level). (B) Representative K+ currents obtained from one COS cell expressing the AKT2 wild type. Currents elicited by 3-s voltage steps from a holding potential of −40 mV to voltages from +140 mV to −180 mV (20-mV decrements; dashed line, zero-current level). (C) Normalized steady-state currents measured at the end of the voltage steps shown in A (AKT2-G186R, gray diamonds) and B (AKT2, black diamonds). To compare currents with a similar instantaneous component, currents were normalized to the amplitudes measured at +60 mV. Current amplitudes measured in the presence of 10 mM Cs+ are indicated (AKT2, dash-dotted line; AKT2-G186R, dashed line). (D) Relative conductance of AKT2 (black symbols) and AKT2-G186R (gray symbols) separated for gating mode#1 (circles) and #2 (triangles). Data are displayed as mean ± SD (n = 4–5). Solid lines represent nonlinear least-squares fittings of Eq. 4 to the data. To reduce the number of free parameters, fits were constrained by the following: (a) only one δ value was adjusted for all four datasets, and (b) the difference in the V1/2 values between the two modes was kept identical in the wild type and in the mutant. The fit yielded δ = 0.71, V1/2 AKT2-mode#1 = −152.3 mV, V1/2 AKT2-mode#2 = +147.1 mV, V1/2 AKT2-G186R-mode#1 = −65.9 mV, V1/2 AKT2-G186R-mode#2 = +233.5 mV.

