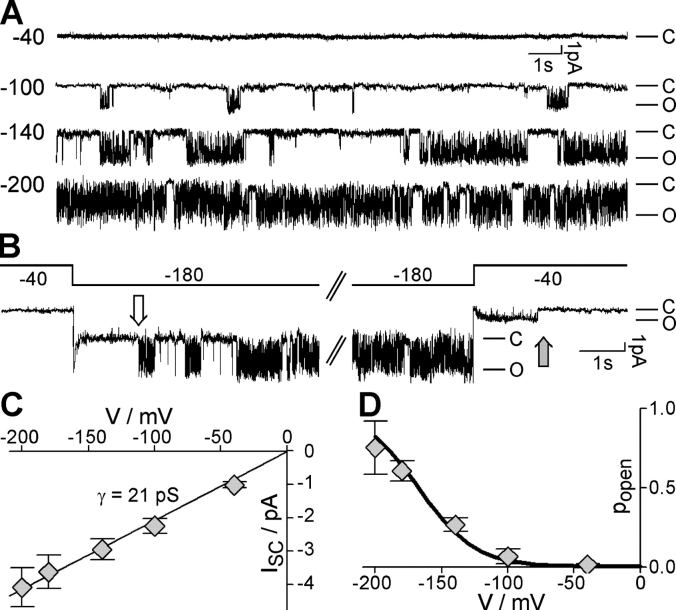
Figure 8.
Single channel behavior of AKT2-K197S expressed in COS cells. (A) Representative single-channel currents (cell-attached) recorded at −40 mV, −100 mV, −140 mV, and −200 mV. C, closed state; O, open channel. (B) Delayed single channel activation and deactivation following voltage steps. Membrane voltage was stepped from −40 mV to −180 mV (left) and back to −40 mV (right). The voltage protocol is indicated. The white arrow illustrates the delayed activation at −180 mV; the gray arrow the delayed deactivation at −40 mV. (C) Current–voltage curve of the open K197S channel. Data are displayed as mean ± SD (n = 3–4). Linear regression (R2 ≈ 0.99) resulted in a single channel conductance of γ ≈ 21 pS (solid line). (D) Voltage-dependent open probability of single K197S channels. Data are displayed as mean ± SD (n = 3–4). Solid line indicates the relative conductance of K197S deduced from macroscopic whole cell currents (from Fig. 7 F).

