
Figure 4.
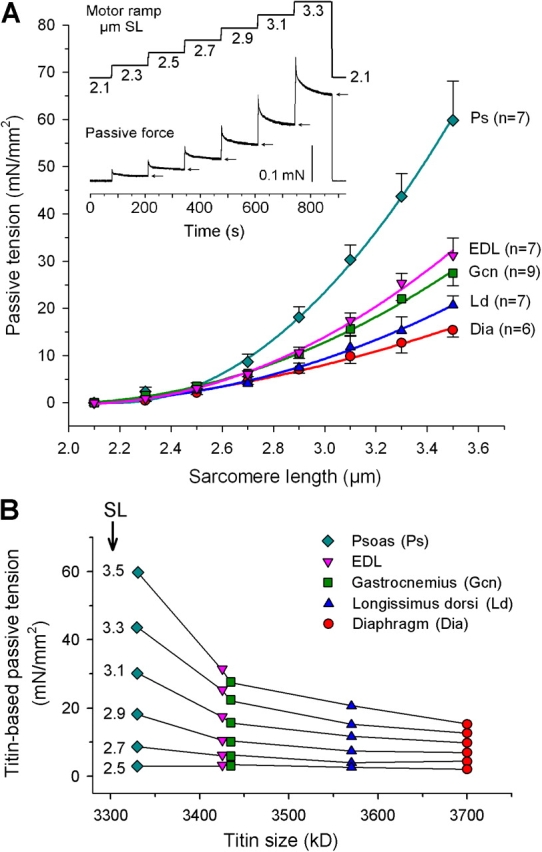
Passive tension of single muscle fibers correlates inversely with titin size. (A) Passive SL–tension curves of single fibers from five different triton-skinned rabbit muscles. Data are means ± SEM. Curves are second-order polynomial fits. Inset, mechanics protocol. Arrows indicate quasi-steady-state force, which was used to calculate PT in the main figure. (B) Single-fiber (titin-based) mean PT at a given sarcomere length (μm; indicated left to each curve) plotted against titin size of the respective rabbit muscles.