
Figure 8.
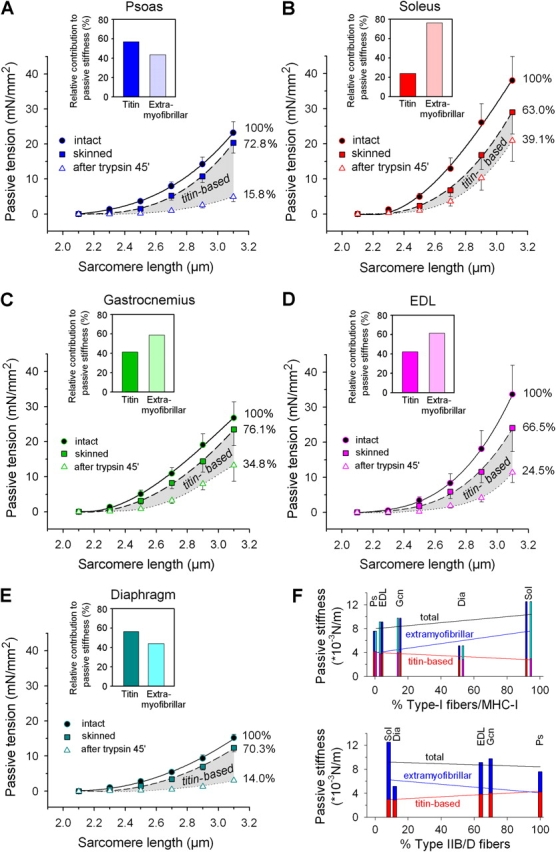
Contribution of titin to total passive stiffness in different muscle types. (A–E) Passive SL–tension curves of muscle strips before (circles; solid curve) and after (squares; dashed curve) skinning with Triton X-100, and following 45-min-long treatment with 0.2 μg/ml trypsin to disrupt titin (triangles; dotted curve). Data points are means ± SEM. Numbers next to curves indicate the remaining relative stiffness after the respective chemical treatments; passive stiffness was calculated from the integrals below the two-order polynomial fit curves. Insets, relative contributions from titin and extramyofibrillar elements to total passive muscle stiffness. (A) Psoas (n = 10), (B) soleus (n = 11), (C) gastrocnemius (n = 5), (D) EDL (n = 5), (E) diaphragm muscle (n = 5). (F) Relationships of total, titin-based, and extramyofibrillar passive stiffness with the relative type-I fiber/MHC-I content (top; MHC, cyan and pink; fibers, blue and red color) and the relative type-IIB/D fiber content (bottom) of the five muscles. Fit curves are linear regressions. Statistically significant correlations were found only for titin-based stiffness: type-I fibers, R = −0.8801, P = 0.0489; MHC-I, R = −0.8834, P = 0.0469; type-IIB/D fibers, R = 0.9806, P = 0.0032.