
Figure 2.
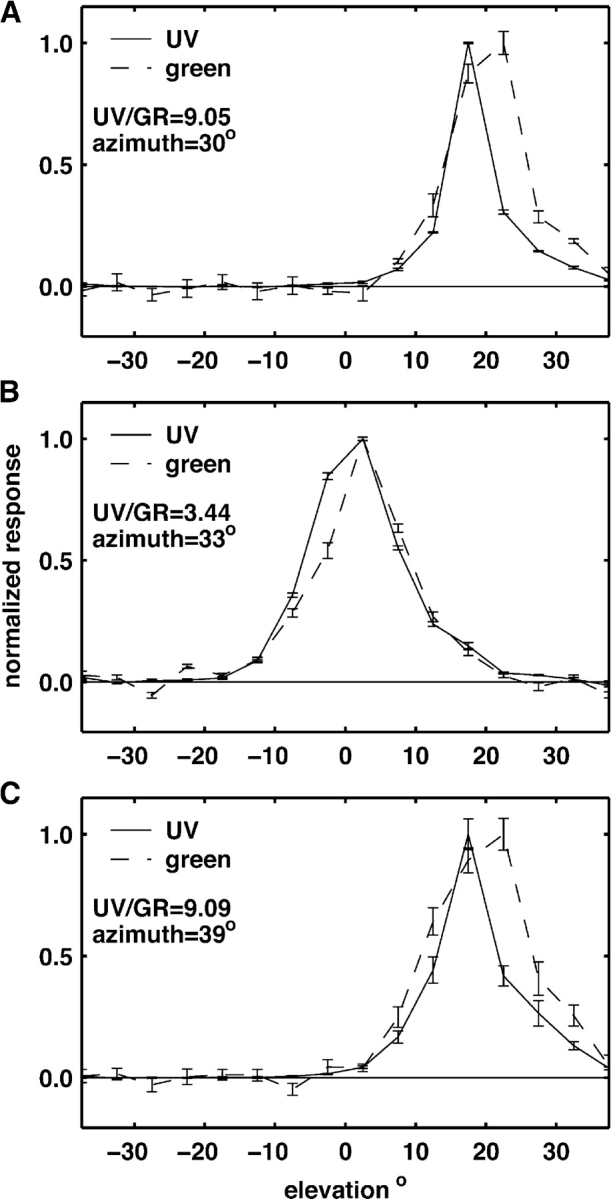
Normalized angular sensitivities in elevation to UV (ρu) and green (ρg) light are shown for three cells A, B, and C. These were obtained by performing a singular value decomposition of the first-order spatiotemporal kernels estimated for these cells. The UV to green ratio, at peak response, is given for each cell (UV/GR), as well as the azimuthal position of the vertically mounted display. Error bars indicate SEM.