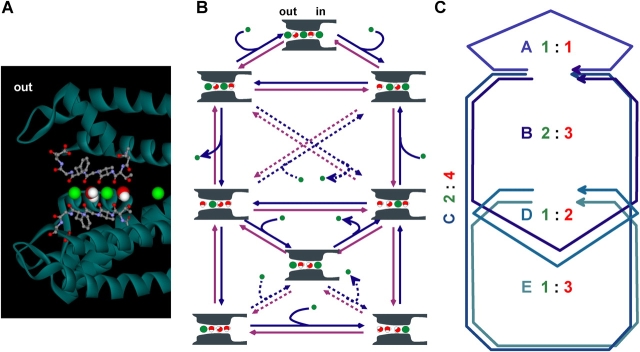
Figure 1.
Permeation of K+ and water molecules through potassium channels. Green, potassium ion; red, water molecule. (A) A distribution of K+ and water molecules in the pore of the KcsA channel. The single-file nature of K+ and water molecules is seen in the selectivity filter. The selectivity filter is shown by the ball-and-stick model. (B) The simplified shift-permeation model for K+ and water permeation through a K+-selective pore (left side, extracellular). Each cartoon represents a K+–water-occupied state in the selectivity filter. Arrows indicate transitions between states, which accompany shift movements of ion–water columns. Blue arrows indicate transitions for efflux; purple arrows for influx. Curved arrows indicate K+ entering or exiting from the selectivity filter. Arrows representing the exchange transitions, in which K+ and a water molecule exchange at either end of the filter and no shift movements accompany, are shown by broken lines. (C) A cycle flux diagram. Each cycle was drawn by connecting states, by completing a cycle, net movements of ion and water were performed. For each cycle, the ratio of coupled transport of K+ and water molecules (K+ [green number]: water molecules [red number]) is indicated (the coupling ratio = water/K+). For example, the cycle A exhibits the coupling ratio of one; the cycle C and D show the coupling ratio of two. At low K+ concentrations, the probability being in cycles at lower positions, such as in cycle D and E, is high. As K+ concentration increases, cycle fluxes at upper positions become predominant. Cycle fluxes with exchange transitions are not shown.

