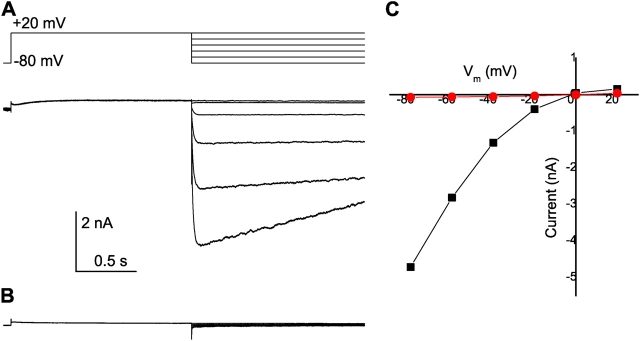
Figure 3.
HERG current expressed in HEK293 cells. (A) Tail current recordings at different potentials. Currents were elicited by depolarizing pulses at +20 mV followed by hyperpolarizing pulses (from 0 to −80 mV). (B) Currents remaining after treatment with 10 μM E-4031. (C) Current–voltage curves of tail currents before (black symbols) and after (red symbols) the treatment of E-4031 measured at 50 ms after the steps to repolarizing potentials.

