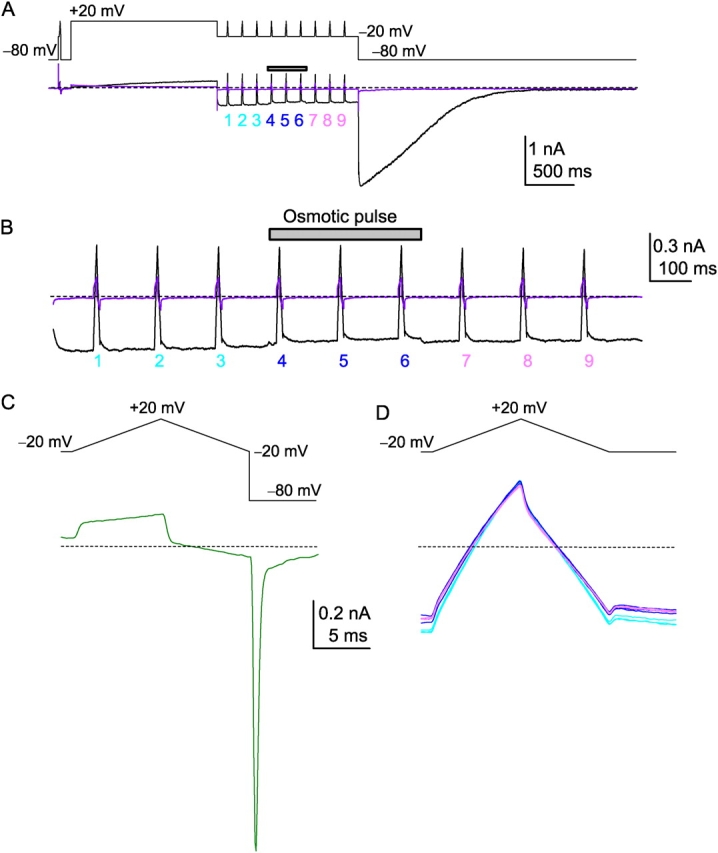
Figure 4.

HERG current recordings and the osmotic pulse. (A) The time course of the current recording in symmetrical 100 mM K+ solution. Top, voltage protocol; Bottom, current traces. Preactivation ramp command: prior to the long depolarization pulse, a brief prepulse to −20 mV followed by a depolarization–repolarization ramp was applied. Activation ramp command: nine ramp commands were delivered at −20 mV (numbering 1 to 9). The osmotic pulse (380 ms, 1000 mOsm) was applied from just before the 4 ramp to just after the 6 ramp. Current trace in violet color indicates recordings after the treatment of E-4031. (B) A train of the ramp currents with an expanded time scale. An osmotic pulse induced a slight depression of the inward current. (C) A current trace (bottom) for the preactivation ramp command (top). (D) Current traces (bottom) for the activation ramp command (top) before (light blue), during (dark blue), and after (light purple) the osmotic pulse. Broken lines indicate the zero current level.
