Figure 5.
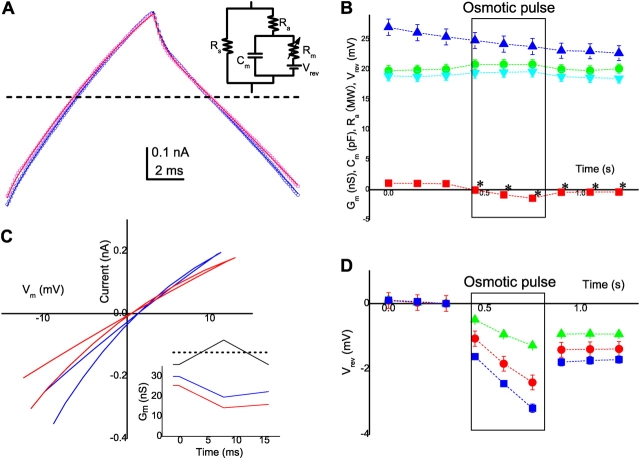
The evaluation of V rev. (A) Recorded ramp currents (open symbols) just before an osmotic pulse (3; blue) and the first one during the osmotic pulse (4; red; 1,000 mOsm). The current through the equivalent membrane circuit (inset, the variable membrane resistance [R m], the membrane capacitance [C m], the series resistance [R a], and the seal resistance [R s]) for the ramp command was simulated. The free parameters (V rev, G m [= 1/R m], R a, and C m) were optimized and the fitted curves were superimposed on the recorded currents. (B) The time course of changes in the fitted parameters during a train. ▴, G m (nS); •, R a (MΩ); ▾, C m (pF); ▪, V rev (mV). The starting time for the first ramp (1) was set to zero. The pulse duration was boxed, starting from 440 ms and ending at 820 ms. The first ramp during the pulse (4) was applied immediately (<10 ms) after the jump. For V rev, error bars were within the sizes of the symbols and the asterisks indicate statistical significance (P < 0.05). (C) I-V curves reconstructed from the fitted parameters for the current traces in A. Current amplitudes were calculated as (V memb[t] − V rev[t]) × G m (t) and plotted as a function of V memb[t]. All the values are time-based variables and a parametric plot was performed. Inset, the ramp command and the time course of the membrane conductance. The conductance changes were correlated to the time course of the ramp command. The slopes of the conductance changes were optimized. (D) The time courses of V rev changes for different osmolalities. ▴, 500 mOsm; •, 1000 mOsm; and ▪, 1500 mOsm. The V rev values were normalized by the values for ramp 3.

