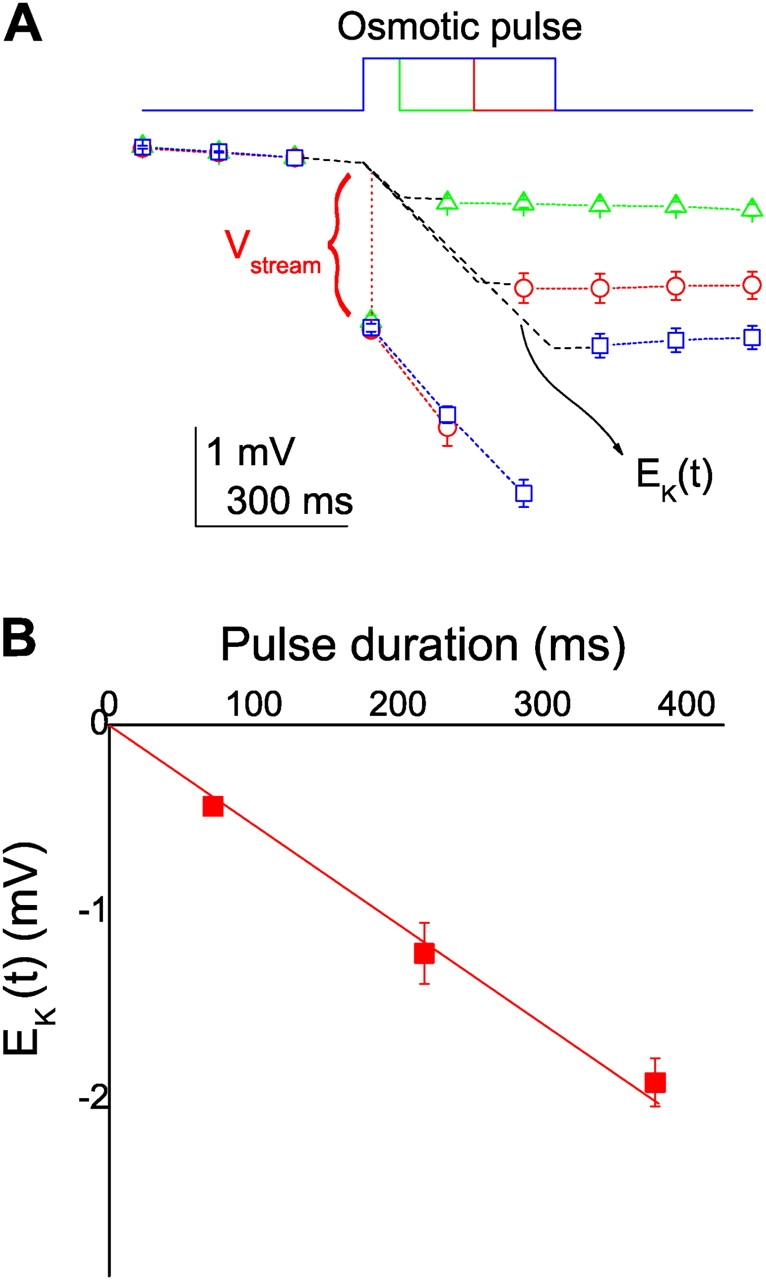
Figure 6.

(A) Time courses of V rev for osmotic pulses with different durations. V rev values for each train were normalized by the value of prepulse (3). Osmotic pulses of 1,500 mOsm were applied for 75, 230, or 380 ms, during which one, two, or three ramps were delivered. The time courses of E K(t) during a pulse was drawn as a broken line through interpolation from the start of the osmotic pulse to the end of the pulse. (B) The V rev value on return to the iso-osmotic solution (E K) as a function of the pulse duration.
