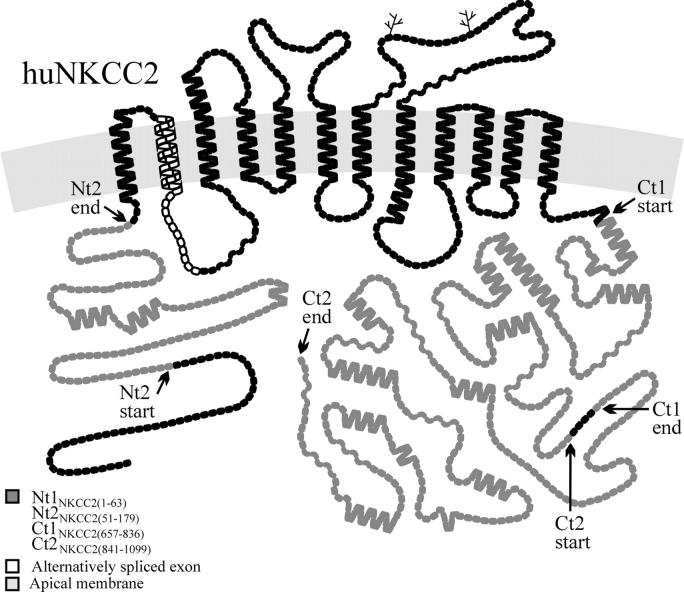
Figure 1.
Hydropathy plot model of huNKCC2. The symbols represent amino acid residues, showing the protein segments Nt2NKCC2(51–179), Ct1NKCC2(657–836), and Ct2NKCC2(841–1099) in gray and the localization of the alternatively spliced exon in white. The nomenclature used to designate these protein segments is explained in MATERIALS AND METHODS and in Table III. The model of huNKCC2 was drawn using the program PLOT (Biff Forbush).

