
Figure 10.
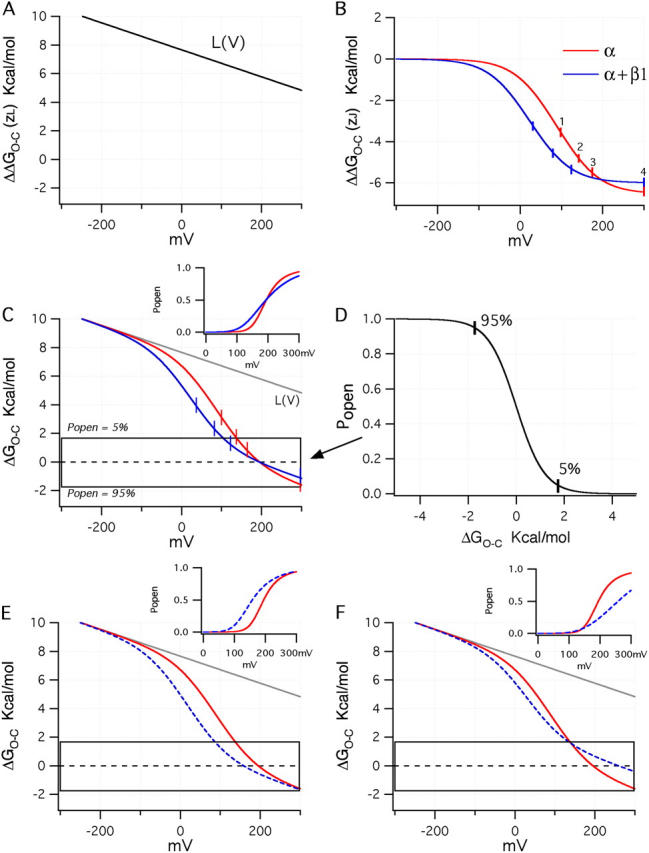
Examining the effects of β1 in energetic terms. (A) Plot of the sum of terms 3 and 4 from Eq. 15. (B) Plots of term 2 from Eq. 15 using either the BKα (red) or BKα+β1 (blue) voltage-sensing parameters (Table II). (C) Plots for both channels of terms 2, 3, and 4 of Eq. 15 combined. In the inset are drawn simulated Popen–V curves for the BKα and BKα+β1 channels based on the parameters in Table II and assuming 0 Ca2+. The boxed region indicates the energy range over which Popen moves from 0.05 (top of box) to 0.95 (bottom of box). A full Popen vs. ΔGO−C is shown in D. In E, a plot is shown like that in C except that V ho for the BKα+β1 channel has been set to −44 mV such that V hc and V ho shift equally upon β1 coexpression. (F) Here V ho for the BKα+β1 channel has been set to −20 mV to mimic a larger change in the coupling factor D upon β1 coexpression.