
Figure 11.
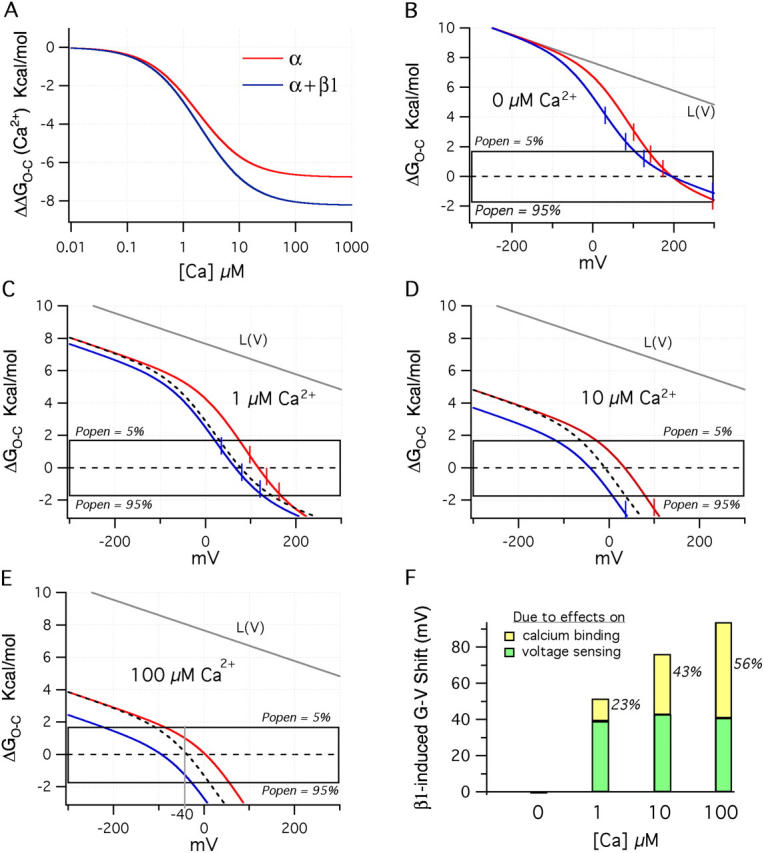
Ca2+ shifts the ΔGO−C–V relations to lower energies. (A) Plot of ΔGO−C vs. Ca2+ concentration for the BKα (red) and BKα+β1(blue) channels using the Ca2+ binding parameters determined from Fig. 11 (A and D). The plots were calculated using term 1 of Eq. 15. (B) As in Fig. 10 C, plotted here are the two model channel's ΔGO−C–V relations in the absence of Ca2+. (C) The same relations now with 1 μM Ca2+, (D) 10 μM Ca2+, and (E) 100 μM Ca2+. The dashed lines in C, D, and E indicate the BKα+β1 curve that would be observed, if there were no changes in Ca2+ bindng upon β1 coexpression. (F) Plotted are the total V1/2 shifts predicted by the BKα and BKα+β1 model channels upon β1 coexpression at 0, 1, 10, and 100 μM Ca2+. In green is the percent of the total shift due to changes in voltage sensing, and in yellow is the percentage due to changes in Ca2+ binding.