
Figure 2.
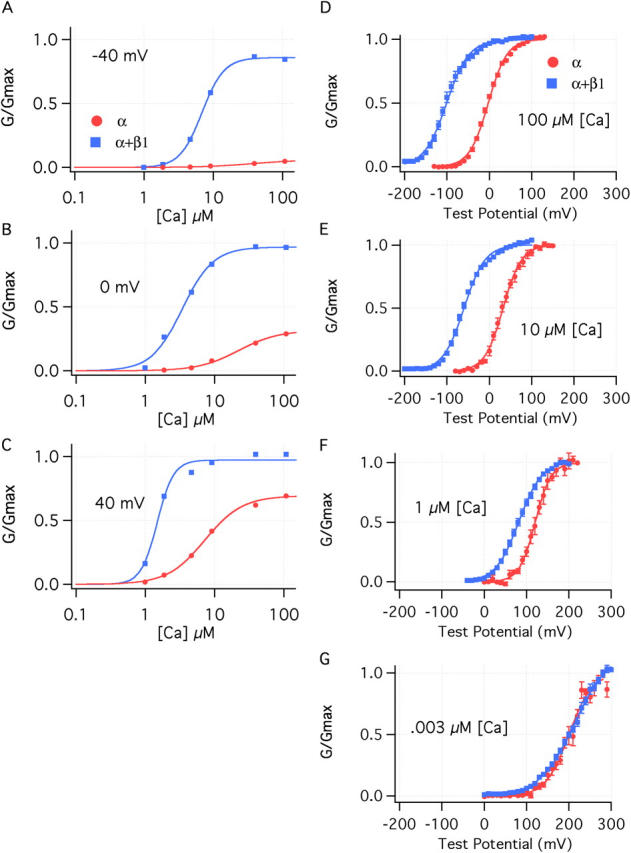
The effects of β1 are both Ca2+ and voltage dependent. (A–C) Ca2+ dose–response curves determined for the BKα and BKα+β1 channel at (A) −40, (B) 0, and (C) +40 mV. Curves are fitted with the hill equation:
 =
= .
.
Fit parameters are as follows: −40 mV, BKα (Kd = 36.5 μM, n = 1.24); BKα+β1(Kd = 6.89 μM, n = 2.7); 0 mV, BKα (Kd = 22.1 μM, n = 1.5); BKα+β1 (Kd = 3.4 μM, n = 1.9); +40 mV, BKα (Kd = 7.25 μM, n = 1.6); BKα+β1(Kd = 3.68 μM, n = 1.5). (D–G) G–V relations are shown for the BKα and the BKα+β1 channel at (D) 100 μM Ca2+, (E) 10 μM Ca2+, (F) 1 μM Ca2+, and (G) 3 nM Ca2+. The curves are fitted with Boltzmann functions as described in the legend to Fig. 1.