
Figure 3.
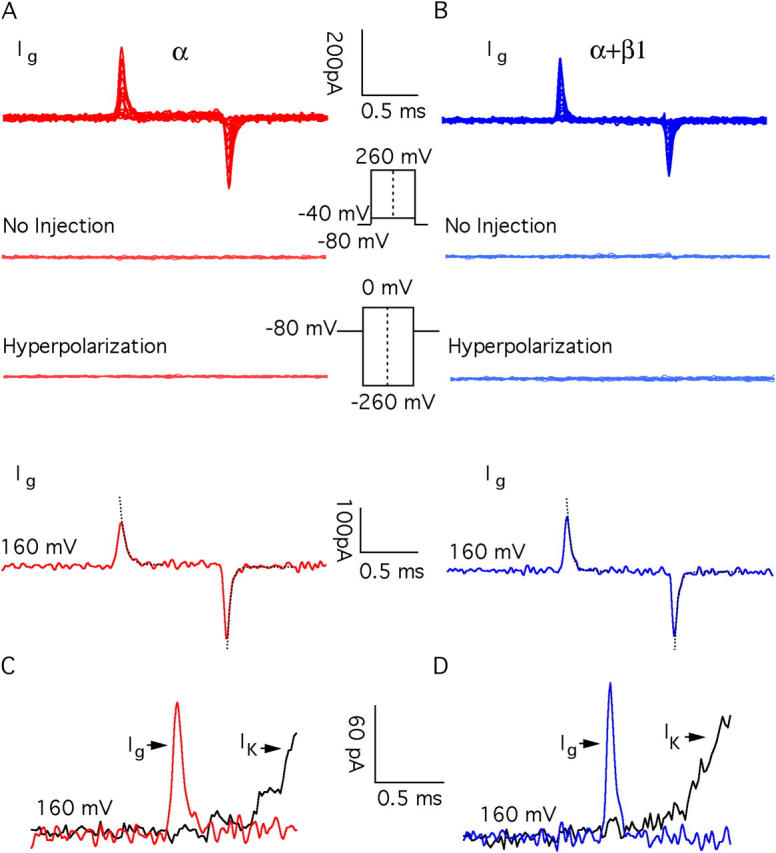
BKCa gating currents. (Top traces) Gating current families recorded from BKα (A) and BKα+β1 (B) channels with 0.5 nM internal Ca2+. The second and third traces in A and B demonstrate that gating currents are not observed in patches from oocytes that were not injected with BKCa cRNA (second) or with hyperpolarizing voltage steps (third). The lowest traces in A and B are gating currents recorded with pulses to +160 mV. Repolarizations are to −80 mV. Exponential fits to the on and off currents are indicated with dashed line. (C and D) Comparisons of on-gating current (Ig) and potassium current (IK) from BKα (C) and BKα+β1 (D) channels. Pulses were to +160 mV. Ca2+ = 0.5 nM. The gating and ionic currents compared in C and D are from different patches.