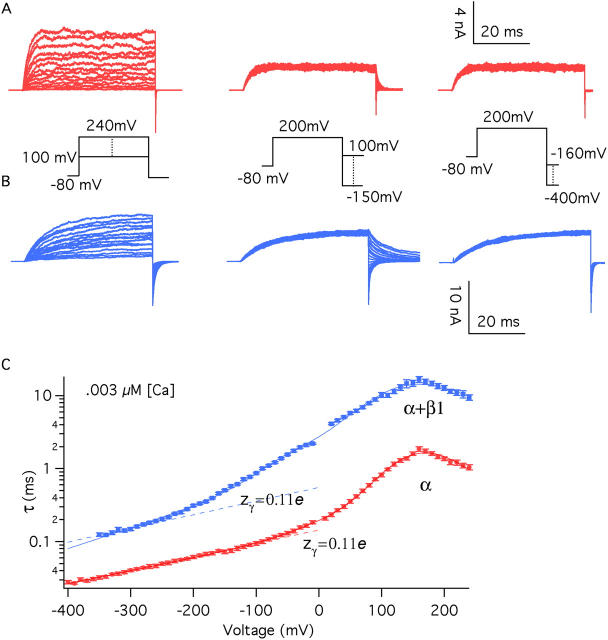
Figure 7.
The β1 subunit does not alter the voltage dependence of the closed-to-open conformational change. Macroscopic ionic currents were recorded from BKα (A) and BKα+β1 (B) channels in excised oocyte macropatches. Voltage steps were varied as indicated, and the time courses of relaxation were fitted with single-exponential functions. Time constants (τ) from the fits are plotted in C. For voltages of +100 mV and greater, activation time constants are plotted. Otherwise deactivation time courses are plotted. The τ–V curves in C were fitted (solid lines) to a function that approximates the kinetics of Scheme I in the limit that voltage sensor movement is fast relative to channel opening and closing (see MATERIALS AND METHODS). The fit parameters were as follows: BKα: held Vhc=151 mV, L = 2.2 × 10⁻⁶, zJ = 0.58 e, zL = 0.41 e, fitting yielded D = 12.6 ± 0.43, zγ = 0.10 ± 0.002 e, γ0(0) = 7452.3 s−1, γ1(0) = 4121.4 s−1, γ2(0) = 5645.8 s−1, γ3(0) = 851 s−1, γ4(0) = 1025 s−1, δ0(0) = 0.016 s−1, δ1(0) = 0.114 s−1, δ2(0) = 1.98 s−1, δ3(0) = 3.76 s−1, δ4(0) = 57.12 s−1; BKα+β1: held Vhc = 80 mV, zJ = 0.57 e, fitting yielded L = 3.3 × 10⁻⁶ ± 6.4 × 10⁻⁶, zL = 0.46 e, D = 10.4 ± 6.4, zγ = 0.17 e, γ0(0) = 931.7 s−1, γ1(0) = 213.2 s−1, γ2(0) = 547.8 s−1, γ3(0) = 333.5 s−1, γ4(0) = 126.7 s−1; δ0(0) = 0.003 s−1, δ1(0) = 0.007 s−1, δ2(0) = 0.198 s−1, δ3(0) = 1.251 s−1, δ4(0) = 4.934 s−1. Both curves are also fitted (dashed lines) at far negative voltages with the following function:
τ= .
.
Fit parameters are as follows: BKα (voltages <−180 mV) γ(0) = 6940.8 s−1, z = 0.11 e; BKα+β1 (voltages <−280 mV) γ(0) = 1808.7 s−1, zγ = 0.11 e.

