
Figure 9.
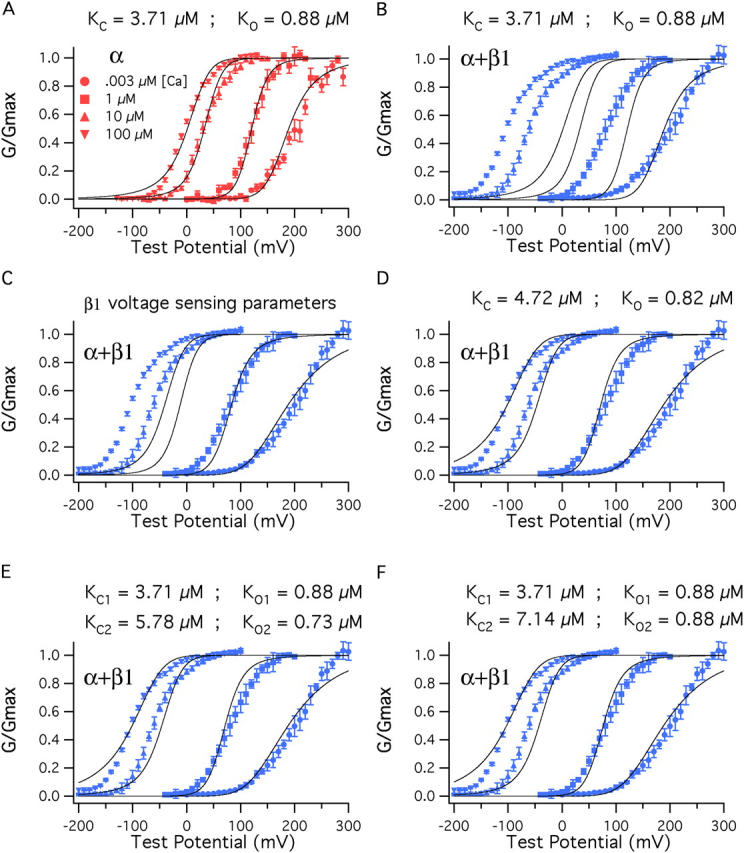
β1 also affects Ca2+ binding. (A) BKα G–V relations at a series of Ca2+ concentrations fitted simultaneously (solid curves) with Eq. 14. Only K C and K O were allowed to vary. The fit yielded K C = 3.71 μM and K O = 0.88 μM. The other parameters of the fit were determined from experiments performed with nominally 0 Ca2+ (3 nM) (V hc = 151 mV, L = 2.2 × 10⁻⁶, V ho = 27 mV, z J = 0.58, z L = 0.41). (B) The fit from A is superimposed on a series of BKα+β1 G–V curves. (C) The voltage-sensing parameters of the model were altered to reflect the changes that occur as β1 binds, V ho = (27→−34 mV), V hc = (151→80 mV), L = (2.2 × 10⁻⁶→2.5 × 10⁻⁶). (D) With BKα+β1 voltage-sensing parameters K C and K O were allowed to vary freely, yielding the fit shown and K C = 4.72 μM, K O = 0.82 μM. (E) Here, the BKα+β1 voltage-sensing parameters were used for the fit, and β1 was allowed to influence only half of the channels' eight Ca2+-binding sites. The data are fit with Eq. 13. K C1 and K O1 were held at 3.71 μM and 0.88 μM, respectively. K C2 and K O2 were allowed to vary freely, yielding K C2 = 5.78 μM, K O2 = 0.73 μM. (F) The data are again fit with Eq. 13 but now K O2 was held at 0.88 μM and only K C2 was allowed to vary. This yielded K C2 = 7.14 μM.