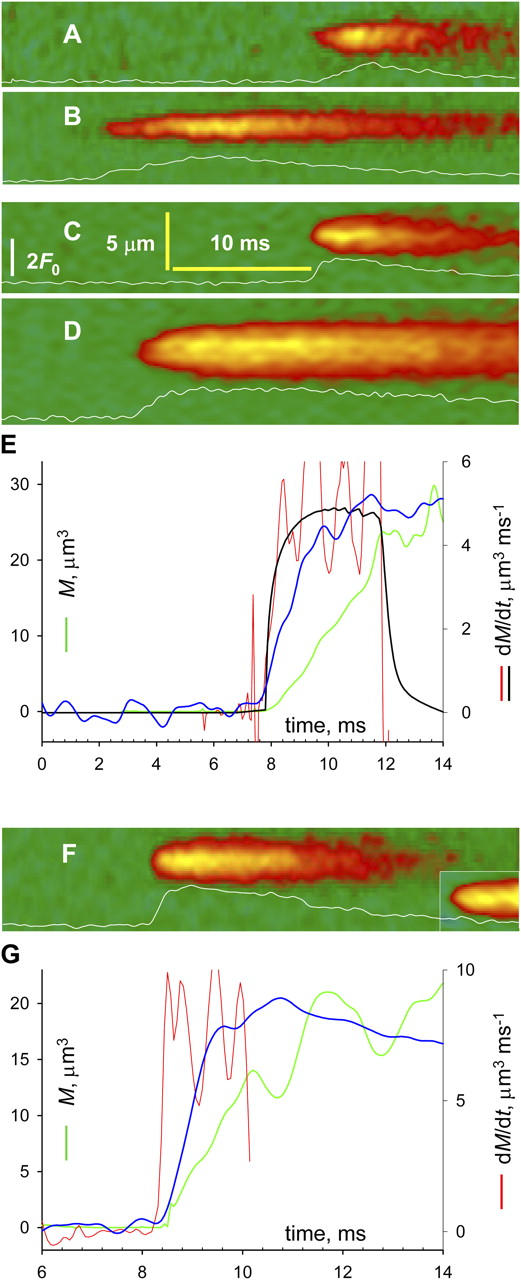
Figure 2.

Sparks at high temporal resolution. Line scans transversal to fiber axis, obtained with the video-rate confocal system. Traces plot ΔF/F 0 averaged at three central pixels. (A and B) Frog cells in glutamate. (C and D) Frog cells in sulfate. (F) Rat cells in sulfate. (E and G) Evolution of variables, calculated for sparks in D and F, respectively. Blue, ΔF/F 0 (full scale is 2 and 2.4 in E and G); green, signal mass M(t); red, Ṁ(t); black, Ṁ (t) in simulation with source of 75 pA, open for 3 ms. Identifiers: A, 091302a4; B, 112902a76; C–E, 032802a3, 2; F and G, 032002a24 and 032002d17.
