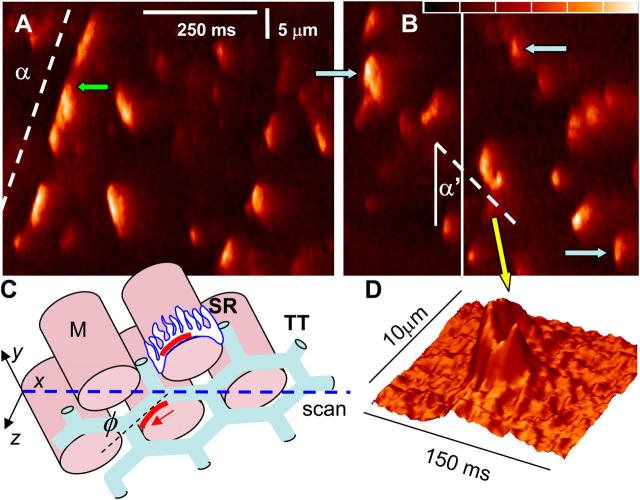
Figure 3.
Propagating activation of release channels. (A and B) Normalized fluorescence in selected areas of line scans of a frog fiber in “sulfate/low Ca2+.” Color scale spans the range 0.8–2.4. Activation propagates at a speed proportional to cot α. (C) Scheme of structures: M, myofibrils; TT, T tubules; SR, sarcoplasmic reticulum, with channel arrays or couplons in red. Transversal scans proceed along x axis (blue). If the direction of propagation separates from the scan line at an angle N (red arrow), then α will increase (e.g., α' in B). Propagating events coexist with others that widen rapidly and reach higher F (blue arrows in B). (D) 3-D representation of event in B where activation appears to turn around a myofibril. Identifiers: A, selected area of 082902b322; B, selected areas of 082902b309, 315.

