
Fig. 2.
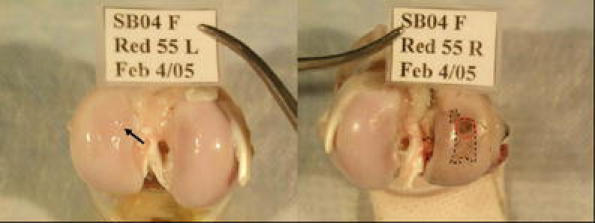
BMP-7 treated (left) and control (right) knee joints from sheep in the post-traumatic osteoarthritis model. In the control joint India ink staining of the joint surface reveals the anterior central impact zone (red circle) as well as areas of progression from the original injury site (dashed line). In the OP-1 treated joint there is a some loss of sheen (arrow) that represents partial loss of the superficial layer of cartilage zone, but little ink uptake