Figure 1.
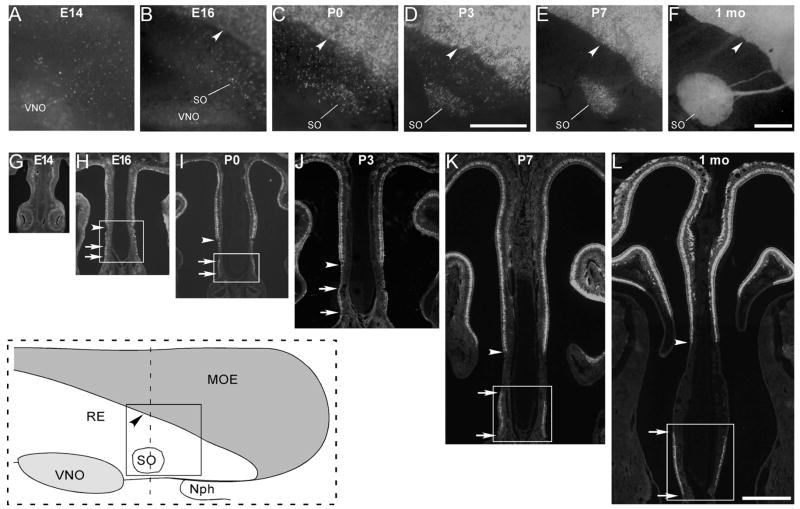
The septal organ gradually separates from the main olfactory epithelium during development. A–F: Fluorescent images were taken from whole-mount septal epithelia of OMP-GFP mice at E14 (A), E16 (B), P0 (C), P3 (D), P7 (E), and 1 month (F). The inset at the lower left corner (within the dashed rectangle) is a schematic drawing of the septal epithelium from 1-month mice, and the solid square indicates the region where the image in F was taken. MOE, main olfactory epithelium; RE, respiratory epithelium; SO, septal organ; VNO, vomeronasal organ; Nph, nasophar-ynx. Arrowheads in (B–F) mark the boundary between MOE and RE in the nasal septum. Scale bars = 0.5 mm. The scale bar in (D) applies to (A–D), and that in (F) applies to (E) and (F). Due to the low fluorescent signal at E14, the image in (A) was taken with an exposure duration that was two times longer than the others. G–L: Fluorescent images were taken from coronal sections (dotted line in the inset) of OMP-GFP mice at E14 (G), E16 (H), P0 (I), P3 (J), P7 (K), and 1 month (1 mo) (L). Arrowheads in (H–L) mark the boundary between MOE and RE, and paired arrows in (H–L) mark the dorsal and ventral boundaries of the septal organ. The rectangles in (H, I, K, L) indicate the regions in which the in situ hybridization images were taken at E16 [Fig. 3(A,D,G)], P0 [Fig. 3(B,E,H)], P7 [Fig. 3(C,F,I)], and 1 month [Fig. 2(A–F)], respectively. The scale bar in L equals 0.5 mm and applies to (G–L).

