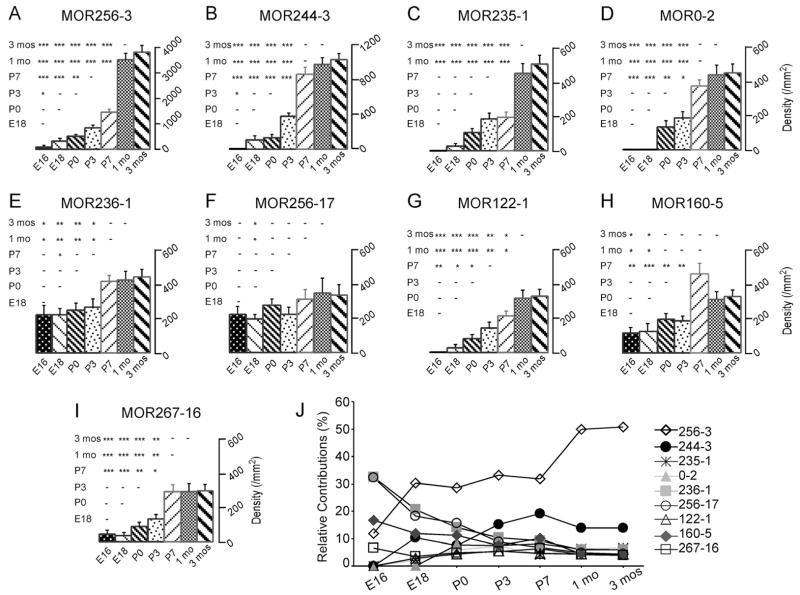
Figure 4.
The cell densities for individual odorant receptors reach a maximum at different stages in the septal organ. A–I: The averaged cell densities per cross-sectional area (cell number/mm2) are plotted for the nine ORs: MOR256-3 (A), MOR244-3 (B), MOR235-1 (C), MOR0-2 (D), MOR236-1 (E), MOR256-17 (F), MOR122-1 (G), MOR160-5 (H) and MOR267-16 (I). Error bars = standard errors. 1 mo = 1 month. 3 mos = 3 months. Pairwise comparison at all time points is obtained by ANOVA post-hoc tests and shown in the triangle matrix. The P value range is marked as *** (p < 0.001), ** (0.001 < p < 0.01), * (0.01 < p < 0.05), or – (a dash, p > 0.05). (J) Relative contributions of the septal organ cells expressing different ORs change during development. At each time point, the averaged cell density of each OR is normalized to the sum of the cell densities from all nine ORs.

