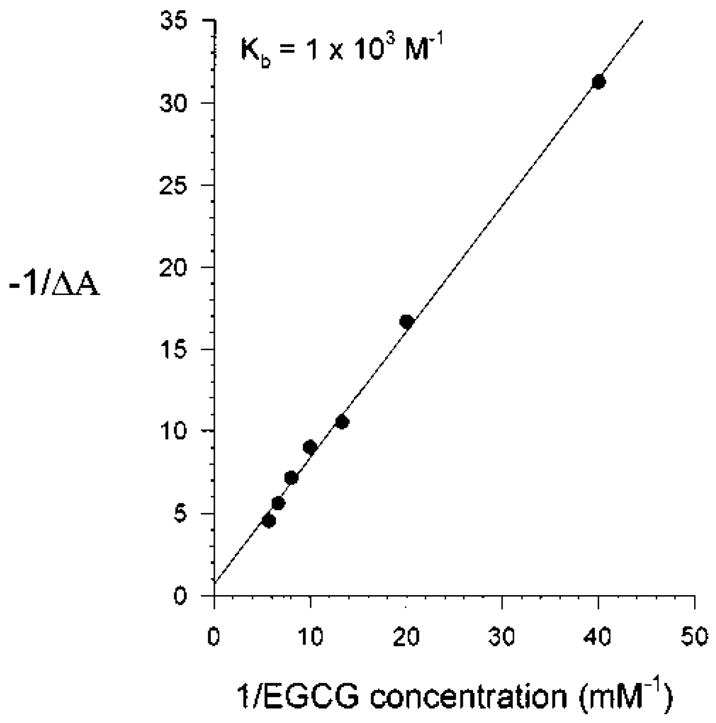
Fig. 6.

Benesi-Hildebrand plot of the data obtained from Figure 5b for the interaction between EGCG/N-hydroxy-IQ. The binding constant (Kb) was obtained from the x-axis intercept, as described previously [Dashwood et al., 1996]. Similar experiments were conducted with other compounds from tea, and the Kb are presented in Table I.
