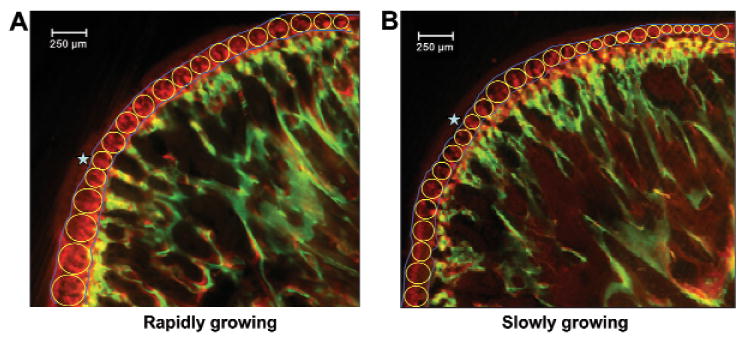
Figure 1.

Measurement method for mineral appositional rate. A series of circles, tangent to end lines (blue) of calcein (green) and alizarin (red) labels, was superimposed over the entire band defined by the two labels. The dark red color (stars) over the alizarin band (stars) is autofluorescence and was not measured.
