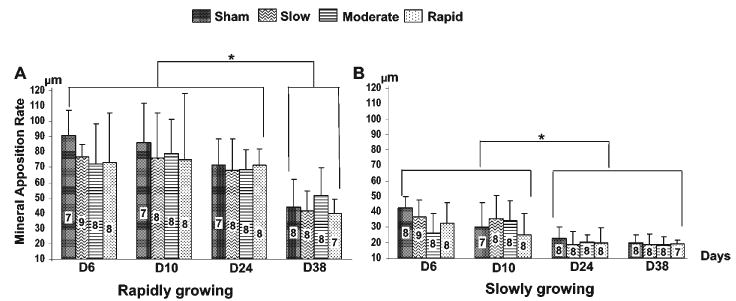
Figure 4.

Comparisons of the effects of distraction rate at each time-point on the mineral apposition rate of the distracted condyle in rapidly (A) and slowly (B) growing rats. Bars indicate the mean values of mineral apposition rate in the condyle of the distracted side at 4 different distraction rates, and vertical lines above the bars indicate one standard deviation. Numbers within each bar indicate sample sizes. Asterisks above the horizontal lines indicate significant differences (p < 0.05) between various time-points for each distraction rate, by non-paired t tests.
