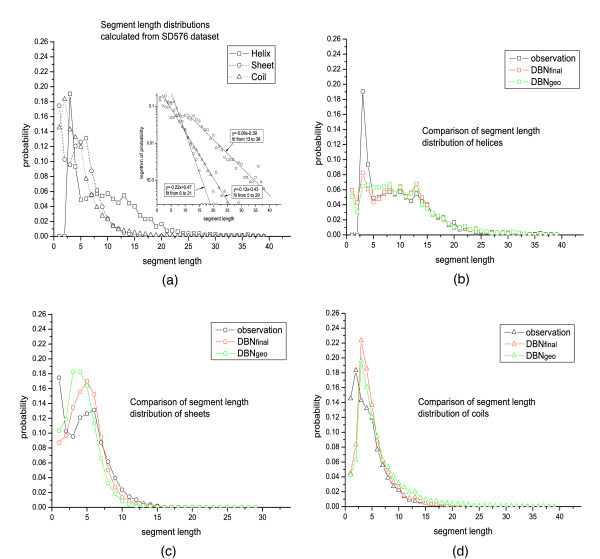
Figure 3.
Segment length distributions of helices, sheets, and coils. (a) The observed distributions calculated directly from SD576 dataset. Inset is lin-log plots of the distributions, where the lines show fitting exponential tails for the three types of secondary structure segments. (b) The comparison between the distribution of helices observed in the dataset and those predicted by DBNfinal and DBNgeo. (c) The comparison of distributions between observation and prediction of sheets. (d) The comparison of distributions between observation and prediction of coils.

