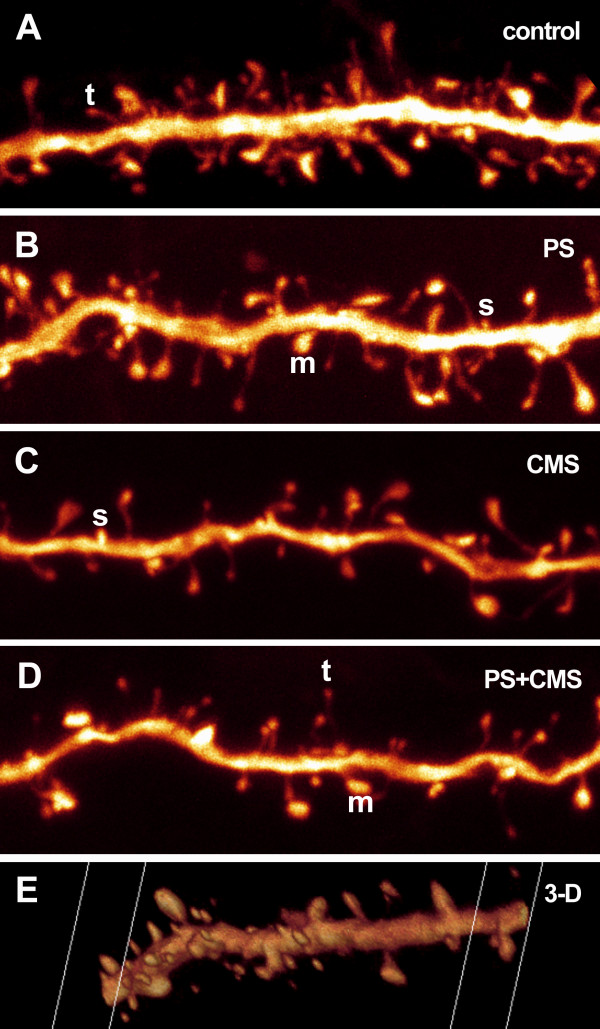
Figure 2.
Maximum intensity projections of details from four of the stacks used for collection of spine data. The images are shown "raw" and have not undergone post-processing, such as contrast-enhancement (only rotation and resampling for screen-fit and printing purposes) (A-D). A screen shot of a three-dimensional (3-D) animation of one of the analyzed dendrites illustrates the 3-D advantage of the method (E). The letters t, m and s exemplify thin, mushroom and stubby spines, respectively.

