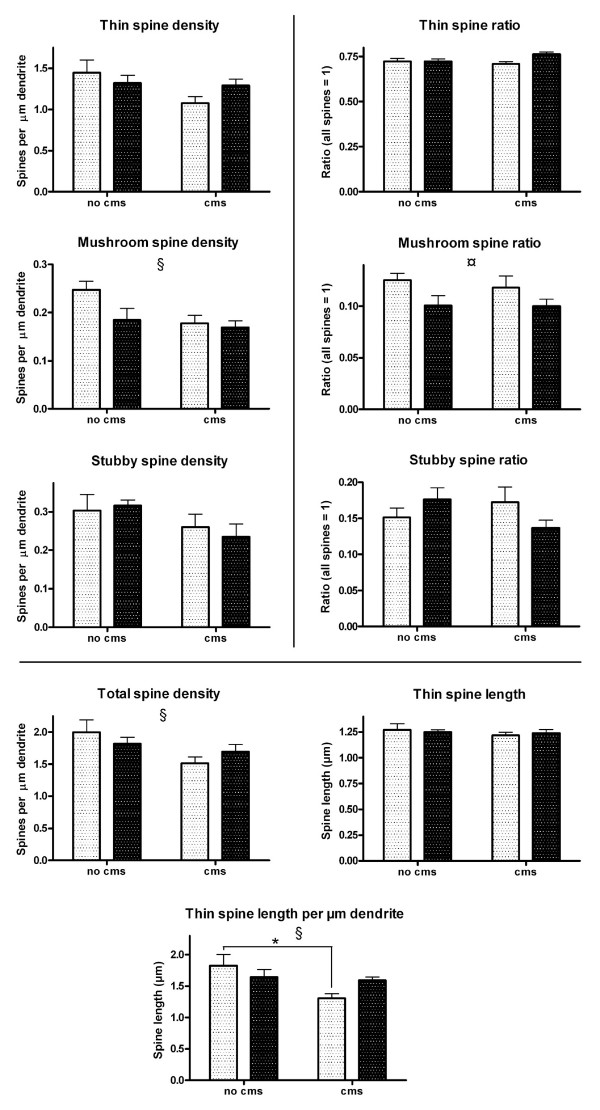
Figure 3.
The densities (left column) and ratios (right column) of each spine type separately. The total density of spines, average length of thin spines and thin spine length per μm dendrite are shown at the bottom. Light columns = no PS; dark columns = PS. Error bars show SEM. § CMS effect (P < 0.05); ¤: PS effect (P < 0.05); *: P < 0.05 in Bonferroni post-hoc analysis. See also tables 1 and 2.

