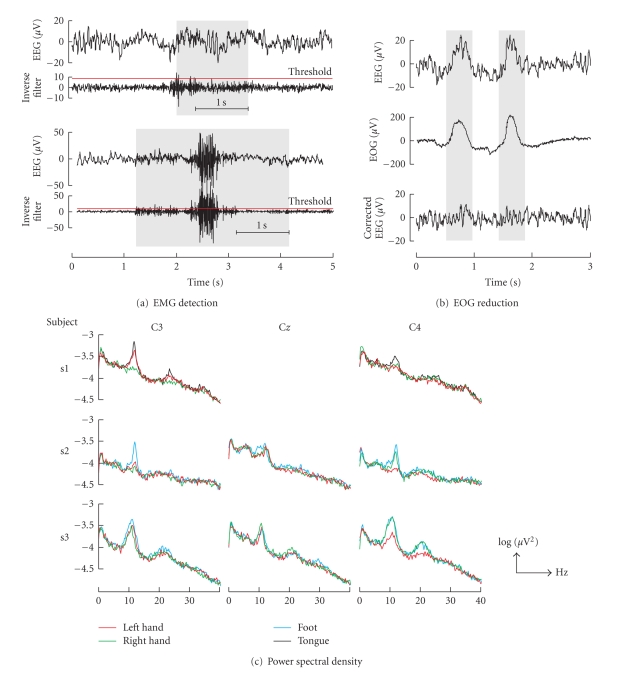
Figure 5.
(a) EMG detection example. The EEG and the inverse filter output are shown for minor (upper part) and massive (lower part) EMG artifacts. (b) Example of EOG reduction. The recorded EEG, EOG channel #2, and the corrected EEG are presented in the upper, middle, and lower parts, respectively. (c) Logarithmic power density spectra of cue-based motor imagery trials (40 each) after 4 hours of feedback training.

