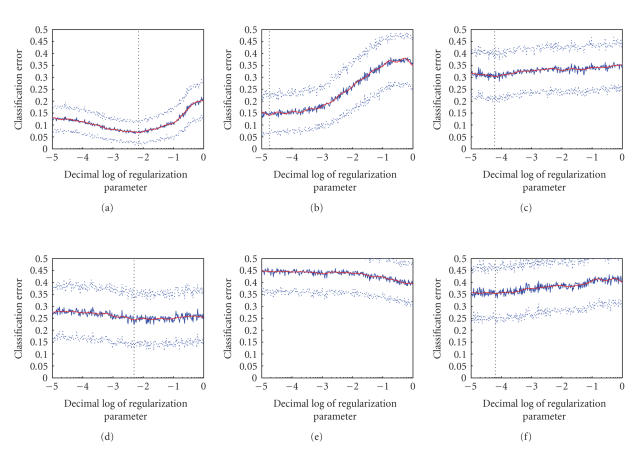
Figure 3.
Prediction error at the best time slice versus log of regularization parameter. (a), (b) predictable subjects —ZK and JMB. (c), (d) unpredictable subjects —TE and ER. (e), (f) control experiments, in which category labels for subjects ZK and JMB were randomly scrambled before constructing the classifier. Classifier's prediction error was estimated using 100-fold cross-validation on 20% of the data. Dotted lines denote 1-std-wide margins of the estimate. The dotted vertical line marks the global minimum of the smoothed error estimate (smooth red line).

