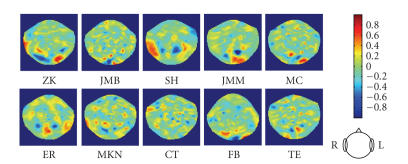
Figure 4.
MEG sensor weight maps for the 10 subjects. Each map corresponds to the time slice and the regularization value that yield lowest prediction error estimate for the given subject. The maps are presented in the order of increasing classifier error (from left to right and from top to bottom).

