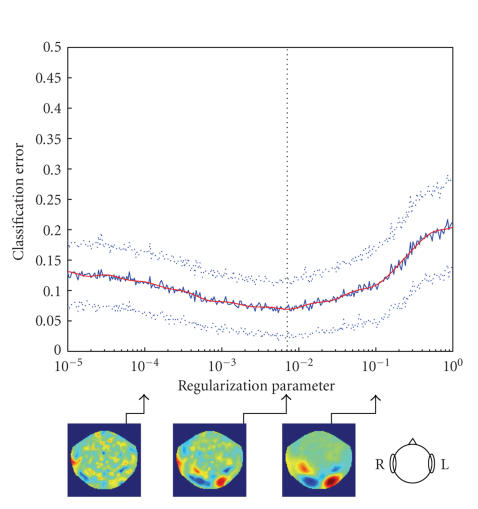
Figure 5.
Error rate as a function of regularization parameter for subject ZK. Solid blue line denotes the average error rate over 100-fold cross-validation, dotted lines mark 1-std-wide margin; the vertical line marks the minimum of the smoothed error rate (red line). Three plots below show the distribution of sensor weights corresponding to different values of the regularization parameter.

