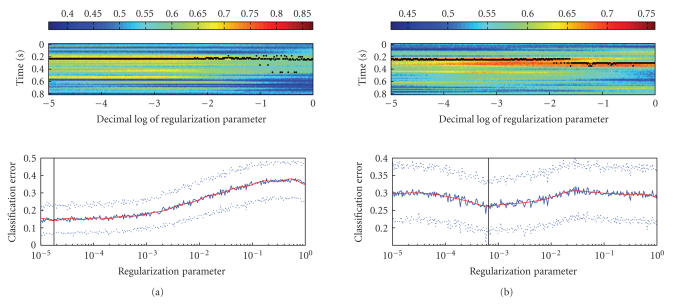
Figure 6.
(a) Temporal stability of the best separating timeslice as a function of regularization parameter for subject JMB. The upper plot shows the accuracy of the classifier as a function of timeslice and regularization parameter. The accuracy is denoted by the color according to the colorbar above the plot. Timeslice yielding maximum accuracy for each value of the regularization parameter is marked by a black dot. The lower part of the plot shows the best (over all timeslices) error plotted against the regularization parameter using the same timescale as the upper part. (b) Same as (a) but for subject MKN.

