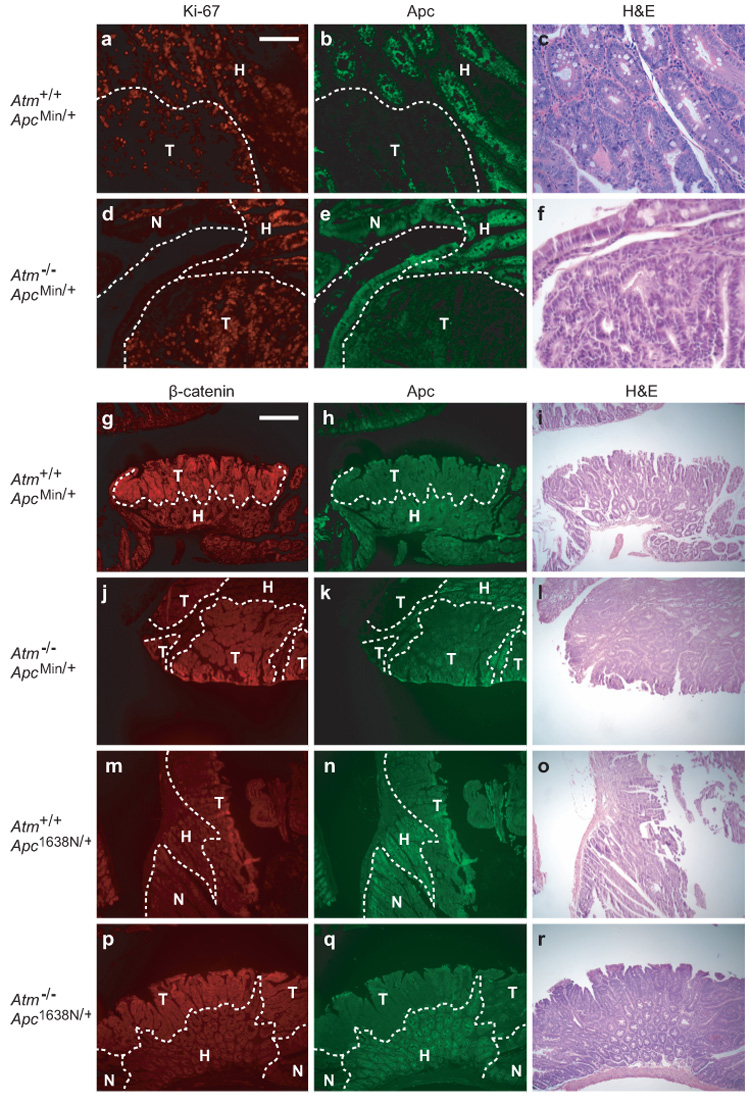
Figure 2.

Ki-67, Apc, and β-catenin staining in intestinal tumors. (a–c) Atm+/+;ApcMin/+ and (d–f) Atm−/−;ApcMin/+ tumors stained for Ki-67 (red), Apc (green) and H&E. (g–i) Atm+/+;ApcMin/+, (j–l) Atm−/−;ApcMin/+, (m–o) Atm+/+;Apc1638N/+, and (p–r) Atm−/−;Apc1638N/+ tumors stained for β-catenin (red), Apc (green) and H&E. Histological classification was determined using Apc levels and cellular morphology. Immunofluorescence was performed as described previously (Haigis et al., 2002). All sections shown are representative. T, tumor; H, tumor-associated hyperplasia; N, normal tissue. Scale bars: a–f, 0.1mm; g–r, 0.4mm.
