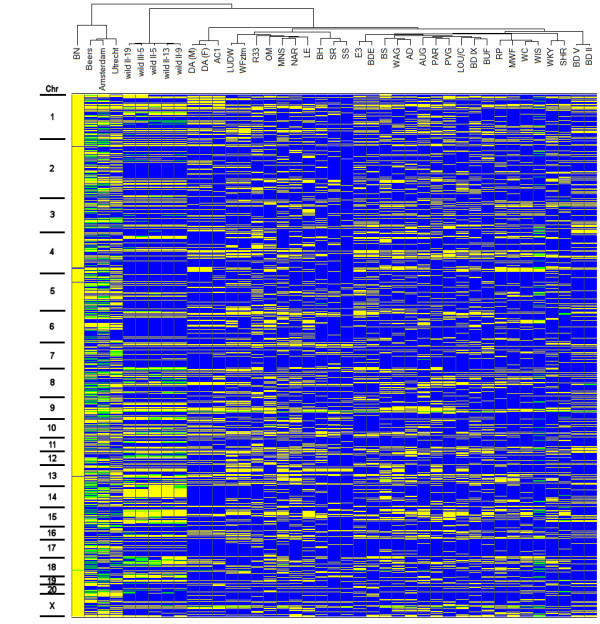
Figure 2.

Heat map of genotyping results of 820 markers in 33 rat strains and 3 wild rats. Markers are sorted by chromosome and the position of the maker on that chromosome. Yellow indicates BN alleles, blue indicates polymorphic alleles as compared to BN and green positions indicate heterozygous genotypes. A hierarchical cluster tree, based on Wards algorithm is shown on top.
