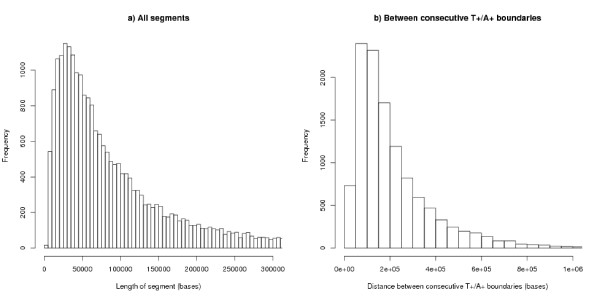
Figure 1.
Histogram of lengths between segment boundaries. (a) All strand bias segments, n = 23482, median = 67289, mean = 109253. Each segment is A+ on one strand and T+ on the other. For comparison the median length of genes is 11622. (b) Distance between consecutive T+/A+ boundaries: n = 11732, median = 160700, mean = 218500, modal value around 100 k. (b) gives an estimate of the size of replicons.

