Figure 1.

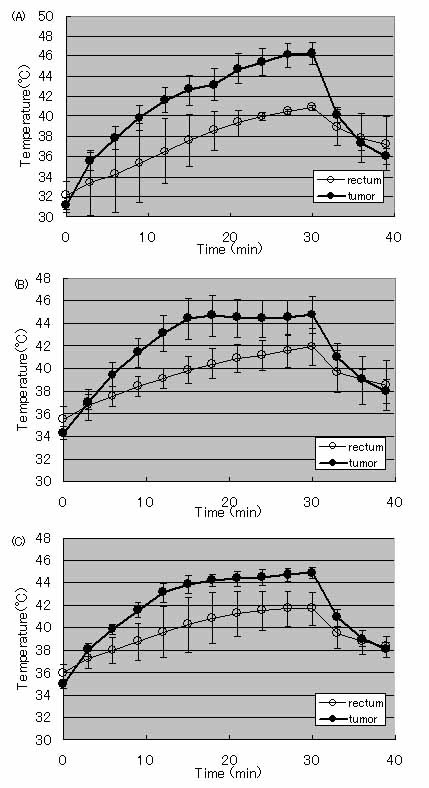
Temperature profiles of the surface of the tumor (closed circles) and rectum (open circles) during the hyperthermia treatment at day 1 (A), 2 (B), and 3 (C). Data points and bars represent the mean and SD of 4 treated rats.

Temperature profiles of the surface of the tumor (closed circles) and rectum (open circles) during the hyperthermia treatment at day 1 (A), 2 (B), and 3 (C). Data points and bars represent the mean and SD of 4 treated rats.